Quantcast
Channel: Lucidworks
Viewing all 731 articles
Browse latest View live

Infographic: The Woes of the CIOs

$
0
0
It’s tough out there for CIOs. They’re getting it from all sides and from all directions. Let’s take a look at the unique challenges CIOs face in trying to keep their organizations competitive and effective: Infographic_CIO_Pain_Points_Lucidworks

The post Infographic: The Woes of the CIOs appeared first on Lucidworks.


Alert! Alert! Alert! (Implementing Alerts in Lucidworks Fusion)

$
0
0
We live in a streaming world.  Tweets, updates, documents, logs, etc. are flowing in all around us all the time, begging us to take action on everything that passes by.  At the same time, our attention span remains finite, so we need a way to separate the proverbial wheat from the chaff, the noise from the signal, the garbage from the gold. We’ve long known that search is great for helping rank what is important in content.  Historians of information retrieval will also note an interest in document routing or document filtering to match documents as they flow in against standing queries from the very early days of search.  However, until recently, with the massive increase in content being ingested by search engines, there hasn’t been much focus on the problem outside of some niche areas. To address the needs of streaming data and alerting, our latest release of Lucidworks Fusion, now includes a fully integrated messaging service as well as pipeline stages for quickly and easily setting up alerts at both index time and search time.  While systems like Percolator (for Elasticsearch) and Luwak (for Solr) use techniques to manage and execute standing (alerting) queries (by storing them as documents), our approach makes it possible to not only match incoming data streams against standing queries, but also include regular expressions, database lookups and other criteria for deciding whether something is alert-worthy or not.  Since our alerting mechanism is fully integrated into our pipeline architecture, any upstream stage can affect how an alert message gets sent. Currently, Fusion ships with support for sending emails and slack messages, but support for other integrations will be coming soon. Let’s take a closer look with a video demo at the functionality and then I’ll show you the underpinnings of how this works in Fusion.  For this demo, I’m going to assume you have downloaded Fusion, unpacked it and logged into the admin console. With the demo now out of the way, let’s dig into how the system works.

Building Blocks

Fusion is made up of a number of services that work together to enable search, recommendations, large scale storage, alerting and other key services for sophisticated search apps.  These services are deployed in almost all cases just as Solr is deployed (see the architecture diagram below for more detail).  To enable alerting, we added a new service for delivering messages, called the Messaging Service, via one or more service providers as well as several new pipeline stages to enable alerting during both indexing and querying. image00

Messaging Service

The Messaging Service provides implementations to send messages of specific types (e.g. Slack, email) to one or more recipients.  It also enables the scheduling of the sending of messages by integrating with Fusion’s built in scheduler.  Furthermore, it can even save all messages to Solr so that they can be searched later.  See the Appendix below on Message Service Configuration for more information on this and other configuration options. The Messaging Service currently supports three services: email, logging and Slack.  To leverage the new messaging service, the service must first be setup.  This can be done via the Fusion Admin (System->Messaging Services) UI, as in the screen grab below or via the API.  Given a configured service instance (hint, the logging service is setup by default), we can then send messages either via a pipeline stage or via the APIs.  We’ll cover the API approach in the next subsection and the pipeline approach in the section below on pipeline stages. image03

Sending a message via the Messaging API

The Messaging API supports the generic concept of a message, which consists of attributes like to, from, subject, body and other fields.  See the Message Attributes section in the Appendix below for the full listing of attributes.  Each Message Service implementation is responsible for interpreting what the attributes mean in the context of its system.    For instance, “to” in the context of Slack means the channel to post the message to while to in the context of email (SMTP) means an email address.  An example Slack message might look like:
[
  {
    "id": "this-is-my-id",
    "type": "slack",
    "subject": "Slackity Slack",
    "body": "This is a slack message that I am sending to the #bottestchannel",
    "to": ["bottestchannel"],
    "from": "bob"
  }
]
An example SMTP message might look like:
[
  {
    "id": "foo",
    "type": "smtp",
    "subject": "Fusion Developer Position",
    "body": "Hi, I’m interested in the engineering posting listed at http://lucidworks.com/company/careers/",
    "to": ["careers@lucidworks.com"],
    "from": "bob@bob.com",
    "messageServiceParams":{
        "smtp.username": "robert.robertson@bob.com",
        "smtp.password": "XXXXXXXX"
    }
  }
]
Depending on how the Message Service template is set up will determine what aspects of the message are sent.  For instance, in the screen grab above, the Slack message service is setup to post the subject and the body as <subject>: <body> to Slack, as set by the Message Template attribute of the service. Tying this all together, we can send the actual message by POSTing the JSON above to the send endpoint, as shown in the screen grab from the Postman REST client plugin for Chrome: POSTman That’s it!  You now have a full messaging service available to use as you see fit.  Just like the rest of Fusion, you can secure access to the messaging service so that only appropriate applications and users can actually send messages.  While the ability to send arbitrary messages is nice to have, the main use of the message service is as part of pipelines, so let’s take a look at how it works.

Pipeline Stages

Lucidworks Fusion ships with both index time and query time pipelines, enabling an easy way to manage dynamic document and query handling experiences.  Each pipeline is made up of one or more stages and an application may have multiple pipelines setup to handle different scenarios, such as for testing different document scenarios, A/B testing and more. In the context of alerting, Fusion 1.4 ships with several new pipelines stages:
  1. SMTP, Slack and Logging Messaging stages for delivering messages
  2. A new, lightweight index only conditional stage (called Set Property)  that handles setting properties without using Javascript
New Fusion Pipeline Stages As you saw in the video, combining these stages enables the ability to send alerting messages when certain conditions are met in the application.  The keys to building more complex alerting systems is to know what values are available in the pipeline, which depends on whether it is a query pipeline or an index pipeline, both of which are outlined below.

Index Pipeline Data Structures

The index pipeline has available two key data structures: 1) the Pipeline Document and 2) The Pipeline Context.  The former, as the name implies, is the actual document that was submitted by the application or the connector, while the latter is a request scoped key/value pair containing information placed in it by upstream stages.  Context items are not automatically added to the document and they do not get sent to Solr upon indexing.  The context is the main way to make flags and other values available to downstream stages.  The best way to see what is in either the document or the pipeline context is to use the Logging Stage or the UI index pipeline preview page.

Query Pipeline Data Structures

The main difference between the index pipeline and the query pipeline is that the document is replaced by access to the request, the response and any headers that are passed in.  As in indexing, the pipeline context is available and has the same semantics as indexing time, albeit with different data in it.  To understand what’s available for data structures, please see the sections on Query Request Objects and Query Response Objects in the documentation.

Next Steps

If you’ve made it this far, you’ve seen a number of new features in action:
  1. A quick demo of setting up an alerting system in Fusion
  2. Sending arbitrary messages via Fusion’s messaging service
  3. Some details on how all of these things are built and where you can find more information
While we love what 1.4 brings to the table for alerting, we have a lot more planned.  For instance, we are currently working on higher level APIs for alerting for those who don’t want to know the fine grained aspects of the pipeline stages as well as more messaging service integrations.  It’s a bit too early to announce the latter just yet, but we can give a hint: it involves integration of several widely deployed messaging systems that will dramatically increase the types of messages you can send as well as add workflow options to those messages.  We will also publish an SDK for the Messaging Service in the near future for those who wish to integrate their own messaging systems into Fusion.  As always, if there is something you’d like to see in Fusion, feel free to contact us.  Otherwise, happy alerting!

Appendix

Message Attributes

Message Attribute Description
id An application specific id for tracking the message.  Must be unique.  If you are not sure what to use, then generate a UUID.
type The type of message to send.  As of 1.4, may be: slack, smtp or log.  Send a GET to http://HOST:PORT/api/apollo/messaging/ to get a list of supported types.
to One or more destinations for the message, as a list.
from Who/what the message is from.
subject The subject of the message.
body The main body of the message.
schedule If the message should be sent at a later time or on a recurring basis, pass in the schedule object.  See the Scheduler documentation for more information.
messageServiceParams Pass in a map of any message service specific parameters.  For instance, the SMTP Message Service requires the application to pass in the SMTP user and password.

Messaging Service Configuration

The Message Service as a system supports two attributes, which can be configured via the configurations API.  The attributes are:
  1. rateLimit — The time, in milliseconds, to wait between sending messages on a per request basis.  Please note, this does not synchronize throttling between different requests.
  2. storeAllMessages — Boolean flag indicating whether we should store/index all messages sent by the system.  By default, only scheduled messages are stored, as they need to be retrieved by the scheduler at a later time.  Storing all messages can be useful for auditing the system, but it will have an impact on the system storage requirements.

A word on String Templates

Woven throughout much of the system is integration with Terence Parr’s excellent String Template library, which we use in several places throughout to “fill in the blanks” of a template with actual values from the working system, such as the name of the document or the query.  You can see this in action on the Messaging Service System setup, where we set the Message Template to be <subject>: <body>, but it is available in many other places as well.  Just look for a mention of “String Template” and know that you can use them as appropriate.

The post Alert! Alert! Alert! (Implementing Alerts in Lucidworks Fusion) appeared first on Lucidworks.

Integrating Storm and Solr

$
0
0
In this post I introduce a new open source project provided by Lucidworks for integrating Solr and Storm. Specifically, I cover features such as micro-buffering, data mapping, and how to send custom JSON documents to Solr from Storm. I assume you have a basic understanding of how Storm works, but if you need a quick refresher, please review the Storm concepts documentation. As you read through this post, it will help to have the project source code on your local machine. After cloning https://github.com/LucidWorks/storm-solr, simply do: mvn clean package. This will create the unified storm-solr-1.0.jar in the target/ directory for the project. The project discussed here started out as a simple bolt for indexing documents in Solr. My first pass at creating Solr bolt was quite simple, but then a number of questions came up that made my simple bolt not quite so simple. For instance, how do I …
  • Separate my application business logic from Storm boilerplate code?
  • Unit test application logic in my bolts and spouts?
  • Run a topology locally while developing?
  • Configure my Solr bolt to specify environment-specific settings like the ZooKeeper connection string needed by SolrCloud?
  • Package my topology into something that can be deployed to a Storm cluster?
  • Measure the performance of my components at runtime?
  • Integrate with other services and databases when building a real-world topology?
  • Map Tuples in my topology to a format that Solr can process?
This is just a small sample of the types of questions that arise when building a high-performance streaming application with Storm. I quickly realized that I needed more than just a Solr bolt. Hence, the project evolved into a toolset that makes it easy to integrate Storm and Solr, as well as addressing all of the questions raised above. I’ll spare you the nitty-gritty details of the framework supporting Solr integration with Storm. If you’re interested, the README for the project contains more details about how the framework was designed.

Packaging and Running a Storm Topology

To begin, let’s understand how to run a topology in Storm. Effectively, there are two basic modes of running a Storm topology: local and cluster mode. Local mode is great for testing your topology locally before pushing it out to a remote Storm cluster, such as staging or production. For starters, you need to compile and package your code and all of its dependencies into a unified JAR with a main class that runs your topology. For this project, I use the Maven Shade plugin to create the unified JAR with dependencies. The benefit of the Shade plugin is that it can relocate classes into different packages at the byte-code level to avoid dependency conflicts. This comes in quite handy if your application depends on 3rd party libraries that conflict with classes on the Storm classpath. You can look at the project pom.xml file for specific details about I use the Shade plugin. For now, let it suffice to say that the project makes it very easy to build a Storm JAR for your application. Once you have a unified JAR (storm-solr-1.0.jar), you’re ready to run your topology in Storm. The project includes a main class named com.lucidworks.storm.StreamingApp that allows you to run a topology locally or in a remote Storm cluster. Specifically, StreamingApp provides the following:
  • Separates the process of defining a Storm topology from the process of running a Storm topology in different environments. This lets you focus on defining a topology for your specific requirements.
  • Provides a clean mechanism for separating environment-specific configuration settings.
  • Minimizes duplicated boilerplate code when developing multiple topologies and gives you a common place to insert reusable logic needed for all of your topologies.
To use StreamingApp, you simply need to implement the StormTopologyFactory interface, which defines the spouts and bolts in your topology:
public interface StormTopologyFactory {
  String getName();
  StormTopology build(StreamingApp app) throws Exception;
}
Let’s look at a simple example of a StormTopologyFactory implementation that defines a topology for indexing tweets into Solr:
class TwitterToSolrTopology implements StormTopologyFactory {
  static final Fields spoutFields = new Fields("id", "tweet")
  String getName() { return "twitter-to-solr" }
  
  StormTopology build(StreamingApp app) throws Exception {
    // setup spout and bolts for accessing Spring-managed POJOs at runtime
    SpringSpout twitterSpout = 
      new SpringSpout("twitterDataProvider", spoutFields);
    SpringBolt solrBolt = 
      new SpringBolt("solrBoltAction", app.tickRate("solrBolt"));
    
    // wire up the topology to read tweets and send to Solr
    TopologyBuilder builder = new TopologyBuilder()
    builder.setSpout("twitterSpout", twitterSpout, 
                      app.parallelism("twitterSpout"))
    builder.setBolt("solrBolt", solrBolt, app.parallelism("solrBolt"))
      .shuffleGrouping("twitterSpout")
    return builder.createTopology()
  }
}
A couple of things should stand out to you in this listing. First, there’s no command-line parsing, environment-specific configuration handling, or any code related to running this topology. All that you see here is code defining a StormTopology; StreamingApp handles all the boring stuff for you. Second, the code is quite easy to understand because it only does one thing. Lastly, this class is written in Groovy instead of Java, which helps keep things nice and tidy and I find Groovy to be more enjoyable to write. Of course if you don’t want to use Groovy, you can use Java, as the framework supports both seamlessly. The following diagram depicts the TwitterToSolrTopology. A key aspect of the solution is the use of the Spring framework to manage beans that implement application specific logic in your topology and leave the Storm boilerplate work to reusable components: SpringSpout and SpringBolt. Screen Shot 2015-05-19 at 11.57.59 AM We’ll get into the specific details of the implementation shortly, but first, let’s see how to run the TwitterToSolrTopology using the StreamingApp framework. For local mode, you would do:
java -classpath $STORM_HOME/lib/*:target/storm-solr-1.0.jar com.lucidworks.storm.StreamingApp \
  example.twitter.TwitterToSolrTopology -localRunSecs 90
The command above will run the TwitterToSolrTopology for 90 seconds on your local workstation and then shutdown. All the setup work is provided by the StreamingApp class. To submit to a remote cluster, you would do:
$STORM_HOME/bin/storm jar target/storm-solr-1.0.jar com.lucidworks.storm.StreamingApp \
  example.twitter.TwitterToSolrTopology -env staging
Notice that I’m using the -env flag to indicate I’m running in my staging environment. It’s common to need to run a Storm topology in different environments, such as test, staging, and production, so that’s built into the StreamingApp framework. So far, I’ve shown you how to define a topology and how to run it. Now let’s get into the details of how to implement components in a topology. Specifically, let’s see how to build a bolt that indexes data into Solr, as this illustrates many of the key features of the framework.

SpringBolt

In Storm, a bolt performs some operation on a Tuple and optionally emits Tuples into the stream. In the example Twitter topology definition above, we see this code:
SpringBolt solrBolt = new SpringBolt("solrBoltAction", app.tickRate("solrBolt"));
This creates an instance of SpringBolt that delegates message processing to a Spring-managed bean with ID “solrBoltAction”. The main benefit of the SpringBolt is it allows us to separate Storm-specific logic and boilerplate code from application logic. The com.lucidworks.storm.spring.SpringBolt class allows you to implement your bolt logic as a simple Spring-managed POJO (Plain Old Java Object). To leverage SpringBolt, you simply need to implement the StreamingDataAction interface:
public interface StreamingDataAction {
  SpringBolt.ExecuteResult execute(Tuple input, OutputCollector collector);
}
At runtime, Storm will create one or more instances of SpringBolt per JVM. The number of instances created depends on the parallelism hint configured for the bolt. In the Twitter example, we simply pulled the number of tasks for the Solr bolt from our configuration:
// wire up the topology to read tweets and send to Solr
...
builder.setBolt("solrBolt", solrBolt, app.parallelism("solrBolt"))
...
The SpringBolt needs a reference to the solrBoltAction bean from the Spring ApplicationContext. The solrBoltAction bean is defined in resources/storm-solr-spring.xml as:
<bean id="solrBoltAction"
      class="com.lucidworks.storm.solr.SolrBoltAction"
      scope="prototype">
  <property name="solrInputDocumentMapper" ref="solrInputDocumentMapper"/>
  <property name="maxBufferSize" value="${maxBufferSize}"/>
  <property name="bufferTimeoutMs" value="${bufferTimeoutMs}"/>
</bean>
There are a couple of interesting aspects of about this bean definition. First, the bean is defined with prototype scope, which means that Spring will create a new instance for each SpringBolt instance that Storm creates at runtime. This is important because it means your bean instance will only be accessed by one thread at a time so you don’t need to worry about thread-safety issues. Also notice that the maxBufferSize and bufferTimeoutMs properties are set using Spring’s dynamic variable resolution syntax, e.g. ${maxBufferSize}. These properties will be resolved during bean construction from a configuration file called resources/Config.groovy. When the SpringBolt needs a reference to solrBoltAction bean, it first needs to get the Spring ApplicationContext. The StreamingApp class is responsible for bootstrapping the Spring ApplicationContext using storm-solr-spring.xml. StreamingApp ensures there is only one Spring context initialized per JVM instance per topology as multiple topologies may be running in the same JVM. If you’re concerned about the Spring container being too heavyweight, rest assured there is only one container initialized per JVM per topology and bolts and spouts are long-lived objects that only need to be initialized once by Storm per task. Put simply, the overhead of Spring is quite minimal especially for long-running streaming applications. The framework also provides a SpringSpout that allows you to implement a data provider as a simple Spring-managed POJO. I’ll refer you to the source code for more details about SpringSpout but it basically follows the same design patterns as SpringBolt.

Environment-specific Configuration

I’ve implemented several production Storm topologies in the past couple years and one pattern that keeps emerging is the need to manage configuration settings for different environments. For instance, we’ll need to index into a different SolrCloud cluster for staging and production. To address this need, the Spring-driven framework allows you to keep all environment-specific configuration properties in the same configuration file, see resources/Config.groovy. Don’t worry if you don’t know Groovy, the syntax of the Config.groovy file is very easy to understand and allows you to cleanly separate properties for the following environments: test, dev, staging, and production. Put simply, this approach allows you to run the topology in multiple environments using a simple command-line switch to specify the environment settings that should be applied -env.

Metrics

Storm provides high-level metrics for bolts and spouts, but if you need more visibility into the inner workings of your application-specific logic, then it’s common to use the Java metrics library, see: https://dropwizard.github.io/metrics/3.1.0/. Fortunately, there are open source options for integrating metrics with Spring, see: https://github.com/ryantenney/metrics-spring. The Spring context configuration file resources/storm-solr-spring.xml comes pre-configured with all the infrastructure needed to inject metrics into your bean implementations. When implementing your StreamingDataAction (bolt) or StreamingDataProvider (spout), you can have Spring auto-wire metrics objects using the @Metric annotation when declaring metrics-related member variables. For instance, the SolrBoltAction class uses a Timer to track how long it takes to send batches to Solr.
@Metric
public Timer sendBatchToSolr;
The SolrBoltAction class provides several examples of how to use metrics in your bean implementations. At this point you should have a basic understanding of the main features of the framework. Now let’s turn our attention to some Solr-specific features.

Micro-buffering and Ack’ing Input Tuples

It’s possible that thousands of documents per second will be flowing into each Solr bolt. To avoid sending too many requests into Solr and to avoid blocking too much in the topology, the bolt uses an internal buffer to send documents to Solr in small batches. This helps reduce the number of network round-trips between your bolt and Solr. The bolt supports a maximum buffer size setting to control when the buffer should be flushed, which defaults to 100. Buffering poses two basic issues in a streaming topology. First, you’re likely using Storm to power a near real-time data processing application, so we don’t want to delay documents from getting into Solr for too long. To support this, the bolt supports a buffer timeout setting that indicates when a buffer should be flushed to ensure documents flow into Solr in a timely manner. Consequently, the buffer will be flushed when either the size threshold or the time limit is reached. There is a subtle side-effect that would normally require a background thread to flush the buffer if there was some delay in messages being sent into the bolt by upstream components. Fortunately, Storm provides a simple mechanism that allows your bolt to receive a special type of Tuple on a periodic schedule, known as a TickTuple. Whenever the SolrBoltAction bean receives a TickTuple, it checks to see if the buffer needs to be flushed, which avoids holding documents for too long and alleviates the need for a background thread to monitor the buffer.

Field Mapping

The SolrBoltAction bean takes care of sending documents to SolrCloud in an efficient manner, but it only works with SolrInputDocument objects from SolrJ. It’s unlikely that your Storm topology will be working with SolrInputDocument objects natively, so the SolrBoltAction bean delegates mapping of input Tuples to SolrInputDocument objects to a Spring-managed bean that implements the com.lucidworks.storm.solr.SolrInputDocumentMapper interface. This fits nicely with our design approach of separating concerns in our topology. The default implementation provided in the project (DefaultSolrInputDocumentMapper) uses Java reflection to read data from a Java object to populate the fields of the SolrInputDocument. In the Twitter example, the default implementation uses Java reflection to read data from a Twitter4J Status object to populate dynamic fields on a SolrInputDocument instance. It should be clear, however, that you can inject your own SolrInputDocumentMapper implementation into the bolt bean using Spring if the default implementation does not meet your needs.

JSON

As of Solr 5, you can send arbitrary JSON documents to Solr and have it parse out documents for indexing. For more information about this cool feature in Solr, please see: http://lucidworks.com/blog/indexing-custom-json-data/ If you want to send arbitrary JSON objects to Solr and have it index documents during JSON parsing, you need to use the solrJsonBoltAction bean instead of solrBoltAction. For our Twitter example, you could define the solrJsonBoltAction bean as:
<bean id="solrJsonBoltAction"
      class="com.lucidworks.storm.solr.SolrJsonBoltAction"
      scope="prototype">
  <property name="split" value="/"/>
  <property name="fieldMappings">
    <list>
      <value>$FQN:/**</value>
    </list>
  </property>
</bean>

Lucidworks Fusion

Lastly, if you’re using Lucidworks Fusion (and you should be), then instead of sending documents directly to Solr, you can send them to a Fusion indexing pipeline using the FusionBoltAction class. FusionBoltAction posts JSON documents to the Fusion proxy which gives you security and the full power of Fusion pipelines for generating Solr documents.

The post Integrating Storm and Solr appeared first on Lucidworks.

Efficient Field Value Cardinality Stats in Solr 5.2: HyperLogLog

$
0
0

Following in the footsteps of the percentile support added to Solr’s StatsComponent in 5.1, Solr 5.2 will add efficient set cardinality using the HyperLogLog algorithm.

Basic Usage

Like most of the existing stat component options, cardinality of a field (or function values) can be requested using a simple local param option with a true value. For example…

$ curl 'http://localhost:8983/solr/techproducts/query?rows=0&q=*:*&stats=true&stats.field=%7B!count=true+cardinality=true%7Dmanu_id_s'
{
  "responseHeader":{
    "status":0,
    "QTime":3,
    "params":{
      "stats.field":"{!count=true cardinality=true}manu_id_s",
      "stats":"true",
      "q":"*:*",
      "rows":"0"}},
  "response":{"numFound":32,"start":0,"docs":[]
  },
  "stats":{
    "stats_fields":{
      "manu_id_s":{
        "count":18,
        "cardinality":14}}}}

Here we see that in the techproduct sample data, the 32 (numFound) documents contain 18 (count) total values in the manu_id_s field — and of those 14 (cardinality) are unique.

And of course, like all stats, this can be combined with pivot facets to find things like the number of unique manufacturers per category…

$ curl 'http://localhost:8983/solr/techproducts/query?rows=0&q=*:*&facet=true&stats=true&facet.pivot=%7B!stats=s%7Dcat&stats.field=%7B!tag=s+cardinality=true%7Dmanu_id_s'
{
  "responseHeader":{
    "status":0,
    "QTime":4,
    "params":{
      "facet":"true",
      "stats.field":"{!tag=s cardinality=true}manu_id_s",
      "stats":"true",
      "q":"*:*",
      "facet.pivot":"{!stats=s}cat",
      "rows":"0"}},
  "response":{"numFound":32,"start":0,"docs":[]
  },
  "facet_counts":{
    "facet_queries":{},
    "facet_fields":{},
    "facet_dates":{},
    "facet_ranges":{},
    "facet_intervals":{},
    "facet_heatmaps":{},
    "facet_pivot":{
      "cat":[{
          "field":"cat",
          "value":"electronics",
          "count":12,
          "stats":{
            "stats_fields":{
              "manu_id_s":{
                "cardinality":8}}}},
        {
          "field":"cat",
          "value":"currency",
          "count":4,
          "stats":{
            "stats_fields":{
              "manu_id_s":{
                "cardinality":4}}}},
        {
          "field":"cat",
          "value":"memory",
          "count":3,
          "stats":{
            "stats_fields":{
              "manu_id_s":{
                "cardinality":1}}}},
        {
          "field":"cat",
          "value":"connector",
          "count":2,
          "stats":{
            "stats_fields":{
              "manu_id_s":{
                "cardinality":1}}}},
    ...
  

cardinality=true vs countDistinct=true

Astute readers may ask: “Hasn’t Solr always supported cardinality using the stats.calcdistinct=true option?” The answer to that question is: sort of.

The calcdistinct option has never been recommended for anything other then trivial use cases because it used a very naive implementation of computing set cardinality — namely: it built in memory (and returned to the client) a full set of all the distinctValues. This performs fine for small sets, but as the cardinality increases, it becomes trivial to crash a server with an OutOfMemoryError with only a handful of concurrent users. In a distributed search, the behavior is even worse (and much slower) since all of those full sets on each shard must be sent over the wire to the coordinating node to be merged.

Solr 5.2 improves things slightly by splitting the calcdistinct=true option in two and letting clients request countDistinct=true independently from the set of all distinctValues=true. Under the covers Solr is still doing the same amount of work (and in distributed requests, the nodes are still exchanging the same amount of data) but asking only for countDistinct=true spares the clients from having to receive the full set of all values.

How the new cardinality option differs, is that it uses probabilistic “HyperLogLog” (HLL) algorithm to estimate the cardinality of the sets in a fixed amount of memory. Wikipedia explains the details far better then I could, but the key points Solr users should be aware of are:

  • RAM Usage is always limited to an upper bound
  • Values are hashed
  • For “small” sets, the implementation and results should be exactly the same as using countDistinct=true (assuming no hash collisions)
  • For “larger” sets, the trade off between “accuracy” and the upper bound on RAM is tunable per request

The examples we’ve seen so far used cardinality=true as a local param — this is actually just syntactic sugar for cardinality=0.33. Any number between 0.0 and 1.0 (inclusively) can be specified to indicate how the user would like to trade off RAM vs accuracy:

  • cardinality=0.0“Use the minimum amount of ram supported to give me a very rough approximate value”
  • cardinality=1.0“Use the maximum amount of ram supported to give me the most accurate approximate value possible”

Internally these floating point values, along with some basic heuristics about the Solr field type (ie: 32bit field types like int and float have a much smaller max-possible cardinality then fields like long, double, strings, etc…) are used to tune the “log2m” and “regwidth” options of the underlying java-hll implementation. Advanced Solr users can provide explicit values for these options using the hllLog2m and hllRegwidth localparams, see the StatsComponent documentation for more details.

Accuracy versus Performance: Comparison Testing

To help showcase the trade offs between using the old countDistinct logic, and the new HLL based cardinality option, I setup a simple benchmark to help compare them.

The initial setup is fairly straight forward:

  • Use bin/solr -e cloud -noprompt to setup a 2 node cluster containing 1 collection with 2 shards and 2 replicas
  • Generated 10,000,000 random documents, each containing 2 fields:
    1. long_data_ls: A multivalued numeric field containing 3 random “long” values
    2. string_data_ss: A multivalued string field containing the same 3 values (as strings)
  • Generate 500 random range queries against the “id” field, such that the first query matches 1000 documents, and each successive query matches an additional 1000 documents

Note that because we generated 3 random values in each field for each documents, we expect the cardinality results of each query to be ~3x the number of documents matched by that query. (Some minor variations may exist if multiple documents just so happened to contain the same randomly generated field values).

With this pre-built index, and this set of pre-generated random queries, we can then execute the query set over and over again with different options to compute the cardinality. Specifically, for both of our test fields, the following stats.field variants were tested:

  • {!key=k countDistinct=true}
  • {!key=k cardinality=true} (the same as 0.33)
  • {!key=k cardinality=0.5}
  • {!key=k cardinality=0.7}

For each field, and each stats.field, 3 runs of the full query set were executed sequentially using a single client thread, and both the resulting cardinality as well as the mean+stddev of the response time (as observed by the client) were recorded.

Test Results

Looking at graphs of the raw numbers returned by each approach isn’t very helpful, it basically just looks like a perfectly straight line with a slope of 1 — which is good. A Straight line means we got the answers we expect.

Exact result values for 'long' field

But the devil is in the details. What we really need to look at in order to meaningfully compare the measured accuracy of the different approaches is the “relative error“. As we can see in this graph below, the most accurate results clearly come from using countDistinct=true. After that cardinality=0.7 is a very close second, and the measured accuracy gets worse as the tuning value for the cardinality option gets lower.

Relative error for 'long' field

Looking at these results, you may wonder: Why bother using the new cardinality option at all?

To answer that question, let’s look at the next 2 graphs. The first shows the mean request time (as measured from the query client) as the number of values expected in the set grows. There is a lot of noise in this graph at the low values due to poor warming queries on my part in the testing process — so the second graph shows a cropped view of the same data

Mean Request timing for the 'long' field
Mean Request timing for the 'long' field (cropped)

Here we start to see some obvious advantage in using the cardinality option. While the countDistinct response times continue to grow and get more and more unpredictable — largely because of extensive garbage collection — the cost (in processing time) of using the cardinality option practically levels off. So it becomes fairly clear that if you can accept a small bit of approximation in your set cardinality statistics, you can gain a lot of confidence and predictability in the behavior of your queries. And by tuning the cardinality parameter, you can trade off accuracy for the amount of RAM used at query time, with relatively minor impacts on response time performance.

If we look at the results for the string field we can see that while the accuracy results are virtually identical to, and the request time performance of the cardinality option is consistent with, that of the numeric fields (due to hashing) the request time performance of countDistinct completely falls apart — even though these are relatively small string values….

Mean Request timing for the 'string' field
Mean Request timing for the 'string' field (cropped)

I would certainly never recommend anyone use countDistinct with non trivial string fields.

Next Steps

There are still several things about the HLL implementation that could be be made “user tunable” with a few more request time knobs/dials once users get a chance to try out and experiment with this new feature and give feedback — but I think the biggest bang for the buck will be to add index time hashing support — which should help a lot in speeding up the response times of cardinality computations using the classic trade off: do more work at index time, and make your on disk index a bit larger, to save CPU cycles at query time and reduce query response time.

The post Efficient Field Value Cardinality Stats in Solr 5.2: HyperLogLog appeared first on Lucidworks.

Data Analytics using Fusion and Logstash

$
0
0

Lucidworks Fusion 1.4 now ships with plugins for Logstash. In my previous post on Log Analytics with Fusion, I showed how Fusion Dashboards provide interactive visualization over time-series data, using a small CSV file of cleansed server-log data. Today, I use Logstash to analyze Fusion’s logfiles – real live messy data!

Logstash is an open-source log management tool. Logstash takes inputs from one or more logfiles, parses and filters them according to a set of configurations, and outputs a stream of JSON objects where each object corresponds to a log event. Fusion 1.4 ships with a Logstash deployment plus a custom ruby class lucidworks_pipeline_output.rb which collects Logstash outputs and sends them to Solr for indexing into a Fusion collection.

Logstash filters can be used to normalize time and date formats, providing a unified view of a sequence of user actions which span multiple logfiles. For example, in an ecommerce application, where user search queries are recorded by the search server using one format and user browsing actions are recorded by the web server in a different format, Logstash provides a way of normalizing and unifying this information into a clearer picture of user behavior. Date and timestamp formats are some of the major pain points of text processing. Fusion provides custom date formatting, because your dates are a key part of your data. For log analytics, when visualizations include a timeline, timestamps are the key data.

In order to map Logstash records into Solr fielded documents you need to have a working Logstash configuration script that runs over your logfiles. If you’re new to Logstash, don’t panic! I’ll show you how to write a Logstash configuration script and then use it to index Fusion’s own logfiles. All you need is a running instance of Fusion 1.4 and you can try this at home, so if you haven’t done so already, download and install Fusion. Detailed instructions are in the online Fusion documentation: Installing Lucidworks Fusion.

Fusion Components and their Logfiles

What do Fusion’s log files look like? Fusion integrates many open-source and proprietary tools into a fault-tolerant, flexible, and highly scalable search and indexing system. A Fusion deployment consists of the following components:

  • Solr – the Apache open-source Solr/Lucene search engine.
  • API – this service transforms documents, queries, and search results. It communicates directly with Solr to carry out the actual document search and indexing.
  • Connectors – the Connector service fetches and ingests raw data from external repositories.
  • UI – the Fusion UI service handles user authentication, so all calls to both the browser-based GUI and the Fusion REST-API go to the Fusion UI. The browser-based GUI controls translate a user action into the correct sequence of calls to the API and Connectors services, and monitor and provide feedback on the results. REST-API calls are handed off to the back-end services after authentication.

Each of these components runs as a process in its own JVM. This allows for distributing and replicating services across servers for performance and scalability. On startup, Fusion reports on its components and the ports that they are listening on. For a local single-server installation with the default configuration, the output is similar to this:

2015-04-10 12:26:44Z Starting Fusion Solr on port 8983
2015-04-10 12:27:14Z Starting Fusion API Services on port 8765
2015-04-10 12:27:19Z Starting Fusion UI on port 8764
2015-04-10 12:27:25Z Starting Fusion Connectors on port 8984

All Fusion services use the Apache log4j logging utility. For the default Fusion deployment, the log4j directives are found in files: $FUSION/jetty/{service}/resources/log4j2.xml and logging outputs are written to files: $FUSION/logs/{service}/{service}.log, where service is either “api”, “connectors”, “solr”, or “ui” and $FUSION is shorthand for the full path to the top-level directory of the Fusion archive, e.g., if you’ve unpacked the Fusion download in /opt/lucidworks, $FUSION refers to directory /opt/lucidworks/fusion, a.k.a. the Fusion home directory. The default deployment for each of these components has most logfile message levels set at “$INFO”, resulting in lots of logfile messages. On startup, Fusion send a couple hundred messages to these logfiles. By the time you’ve configured your collection, datasource, and pipeline, you’ll have plenty of data to work with!

Data Design: Logfile Patterns

First I need to do some preliminary data analysis and data design. What logfile data do I want to extract and analyze?

All the log4j2.xml configuration files for the Fusion services use the same Log4j pattern layout:

<PatternLayout>
  <pattern>%d{ISO8601} - %-5p [%t:%C{1}@%L] - %m%n</pattern>
</PatternLayout>

In the Log4j syntax, the percent sign is followed by a conversion specifier (think c-style printf). In this pattern, the conversion specifiers used are:

  • %d{ISO8601} : date format, with date specifier ISO8601
  • %-5p : %p is the Priority of the logging event, “-5″ specifies left-justified, with of 5 characters
  • %t: thread
  • %C{1}: %C specifies the fully qualified class name of the caller issuing the logging request, {1} specifies the number of rightmost components of the class name.
  • %L: line number of where this request was issued
  • %m: the application supplied message.

Here’s what what the resulting log file messages looks like:

2015-05-21T11:30:59,979 - INFO  [scheduled-task-pool-2:MetricSchedulesRegistrar@70] - Metrics indexing will be enabled
2015-05-21T11:31:00,198 - INFO  [qtp1990213994-17:SearchClusterComponent$SolrServerLoader@368] - Solr version 4.10.4, using JavaBin protocol
2015-05-21T11:31:00,300 - INFO  [solr-flush-0:SolrZkClient@210] - Using default ZkCredentialsProvider

To start with, I want to capture the timestamp, the priority of the logging event, and the application supplied message. The timestamp should be stored in a Solr TrieDateField, the event priority is a set of strings used for faceting, and the application supplied message should be stored as searchable text. Thus, in my Solr index, I want fields:

  • log4j_timestamp_tdt
  • log4j_level_s
  • log4j_message_t

Note that these field names all have suffixes which encode the field type: the suffix “_tdt” is used for Solr TrieDateFields, the suffix “_s” is used for Solr string fields, and the suffix “_t” is used for Solr text fields.

A grok filter is applied to input line(s) from a logfile and outputs a Logstash event which is a list of field-value pairs produced by matches against a grok pattern. A grok pattern is specified as: %{SYNTAX:SEMANTIC}, where SYNTAX is the pattern to match against, SEMANTIC is the field name in the Logstash event. The Logstash grok filter used for this example is:

 %{TIMESTAMP_ISO8601:log4j_timestamp_tdt} *-* %{LOGLEVEL:log4j_level_s}\s+*[*\S+*]* *-* %{GREEDYDATA:log4j_msgs_t}
This filter uses three grok patterns to match the log4j layout:
  • The Logstash pattern TIMESTAMP_ISO8601 matches the log4j timestamp pattern %d{ISO8601}.
  • The Logstash pattern LOGLEVEL matches the Priority pattern %p.
  • The GREEDYDATA pattern can be used to match everything left on the line.

I used the Grok Constructor tool to develop and test my log4j grok filter. I highly recommend this tool and associated website to all Logstash noobs – I learned alot!

To skip over the [thread:class@line] - information, I’m using the regex "*[*\S+*]* *-*". Here the asterisks act like single quotes to escape characters which otherwise would be syntactically meaningful. This regex fails to match class names which contain whitespace, but it fails conservatively, so the final greedy pattern will still capture the entire application output message.

To apply this filter to my Fusion logfiles, the complete Logstash script is:

input {
    file { 
        path => '/Users/mitzimorris/fusion/logs/ui/ui.log'
        start_position => 'beginning'
        codec => multiline {
            pattern => "^%{TIMESTAMP_ISO8601} "
            negate => true
            what => previous
        }
    }
    file { 
        path => '/Users/mitzimorris/fusion/logs/api/api.log'
        start_position => 'beginning'
        codec => multiline {
            pattern => "^%{TIMESTAMP_ISO8601} "
            negate => true
            what => previous
        }
    }
    file { 
        path => '/Users/mitzimorris/fusion/logs/connectors/connectors.log'
        start_position => 'beginning'
        codec => multiline {
            pattern => "^%{TIMESTAMP_ISO8601} "
            negate => true
            what => previous
        }
    }
}
filter {
    grok {
        match => { 'message' => '%{TIMESTAMP_ISO8601:log4j_timestamp_tdt} *-* %{LOGLEVEL:log4j_level_s}\s+*[*\S+*]* *-* %{GREEDYDATA:log4j_msgs_t}' }
    }
}
output {
}

This script specifies the set of logfiles to monitor. Since logfile messages may span multiple lines, for each logfile I use a Logstash codec, for multiline files, following the Logstash docs example. This codec is the same for all files but must be applied to each input file in order to avoid interleaving lines from different logfiles. The actual work is done in the filter clause, by the grok filter discussed above.

Indexing Logfiles with Fusion and Logstash

Using Fusion to index the Fusion logfiles requires the following:

  • A Fusion Collection to hold the logfile data
  • A Fusion Datasource that uses the Logstash configuration to process the logfiles
  • A Fusion Index Pipeline which transforms Logstash records into a Solr document.

Fusion Collection: MyFusionLogfiles

A Fusion collection is a Solr collection plus a set of Fusion components. The Solr collection holds all of your data. The Fusion components include a pair of Fusion pipelines: one for indexing, one for search queries.

I create a collection named “MyFusionLogfiles” using the Fusion UI Admin Tool. Fusion creates an indexing pipeline called “MyFusionLogfiles-default”, as well as a query pipeline with the same name. Here is the initial collection:

new collection

Logstash Datasource: MyFusionLogfiles-datasource

Fusion calls Logstash using a Datasource configured to connect to Logstash.

Datasources store information about how to ingest data and they manage the ongoing flow of data into your application: the details of the data repository, how to access the repository, how to send raw data to a Fusion pipeline for Solr indexing, and the Fusion collection that contains the resulting Solr index. Fusion also records each time a datasource job is run and records the number of documents processed.

Datasources are managed by the Fusion UI Admin Tool or by direct calls to the REST-API. The Admin Tool provides a home page for each collection as well as datasources panel. For the collection named “MyFusionLogfiles” the URL of the collection home page is: http://<server>:<port>/admin/collections/MyFusionLogfiles and the URL of the datasources panel is http://<server>:<port>/admin/collections/MyFusionLogfiles/datasources.

To create a Logstash datasource, I choose “Logging” datasource of type “Logstash”. In the configuration panel I name the datasource “MyFusionLogfiles-datasource”, specify “MyFusionLogfiles-default” as the index pipeline to use, and copy the Logstash script into the Logstash configuration input box (which is a JavaScript enabled text input box).

new datasource

Index Pipeline: MyFusionLogfiles-default

An Index pipeline transforms Logstash records into fielded documents for indexing by Solr. Fusion pipelines are composed of a sequence of one or more stages, where the inputs to one stage are the outputs from the previous stage. Fusion stages operate on PipelineDocument objects which organize the data submitted to the pipeline into a list of named field-value pairs, (discussed in a previous blog post). All PipelineDocument field values are strings. The inputs to the initial index pipeline stage are the output from the connector. The final stage is a Solr Indexer stage which sends its output to Solr for indexing into a Fusion collection.

In configuring the above datasource, I specified index pipeline “MyFusionLogfiles-default”, the index pipeline created in tandem with collection “MyFusionLogfiles”, which, as initially created, consists of a Solr Indexer stage:

default index pipeline

The job of the Solr Indexer stage is to transform the PipelineDocument into a Solr document. Solr provides a rich set of datatypes, including datetime and numeric types. By default, a Solr Indexer stage is configured with property “enforceSchema” set to true, so that for each field in the PipelineDocument, the Solr Indexer stage checks the field name to see whether it is a valid field name for the collection’s Solr schema and whether or not the field contents can be converted into a valid instance of the Solr field’s defined datatype. If the field name is unknown or the PipelineDocument field is recognized as a Solr numeric or datetime field, but the field value cannot be converted to the proper type, then the Solr indexer stage transforms the field name so that the field contents are added to the collection as a text data field. This means that all of your data will be indexed into Solr, but the Solr document might not have the set of fields that you expect, instead your data will be in a field with an automatically generated field name, indexed as text.

Note that above, I carefully specified the grok filter so that the field names encode the field types: field “log4j_timestamp_tdt” is a Solr TrieDateField, field “log4j_level_s” is a Solr string field, and field “log4j_message_t” is a Solr text field.

Spoiler alert: this won’t work. Stay tuned for the fail and the fix.

Running the Datasource

To ingest and index the Logstash data, I run the configured datasource using the controls displayed underneath the datasource name. Here is a screenshot of the “Datasources” panel of the the Fusion UI Admin Tool while the Logstash datasource “MyFusionLogfiles-datasource” is running:

running datasource

Once started, a Logstash connector will continue to run indefinitely. Since I’m using Fusion to index its own logfiles, including the connectors logfile, running this datasource will continue to generate new logfile entries to index. Before starting this job, I do a quick count on the number of logfile entries across the three logfiles I’m going to index:

> grep "^2015" api/api.log connectors/connectors.log ui/ui.log | wc -l
   1537

After a few minutes, I’ve indexed over 2000 documents, so I click on the “stop” control. Then I go back to the “home” panel and check my work by running a wildcard search (“*”) over the collection “MyFusionLogfiles”. The first result looks like this:

MyFusionLogs documents

This result contains the fail that I promised. The raw logfile message was:

2015-05-27T02:45:36,591 - INFO [zkCallback-8-thread-3:ConnectionManager@102] - Watcher org.apache.solr.common.cloud.ConnectionManager@7bee2d2c name:ZooKeeperConnection Watcher:localhost:9983 got event WatchedEvent state:Disconnected type:None path:null path:null type:None

The document contains fields named “log4j_level_s” and “log4j_msgs_t”, but there’s no field named “log4j_timestamp_tdt” – instead there’s a field “attr_log4j_timestamp_tdt_” with value “2015-05-27T02:45:36,591″. This is the work of the Solr indexer stage, which renamed this field by adding the prefix “attr_” as well as a suffix “_”. The Solr schemas for Fusion collections have a dynamic field definition:

<dynamicField name="attr_*" type="text_general" indexed="true" stored="true" multiValued="true"/>

This explains the specifics of the resulting field name and field type, but it doesn’t explain why this remapping was necessary.

Fixing the Fail

Why isn’t the Log4j timestamp “2015-05-27T02:45:36,591″ a valid timestamp for Solr? The answer is that the Solr date format is:

 yyyy-MM-dd'T'HH:mm:ss.SSS'Z'

‘Z’ is the special Coordinated Universal Time (UTC) designator. Because Lucene/Solr range queries over timestamps require timestamps to be strictly comparable, all date information must be expressed in UTC. The Log4j timestamp presents two problems:

  • the Log4j timestamp uses a comma separator between seconds and milliseconds
  • the Log4j timestamp is missing the ‘Z’ and doesn’t include any timezone information.
The first problem is just a simple formatting problem. The second problem is non-trivial: the Log4j timestamps aren’t in UTC already, they’re expressed as the current local time of whatever machine the instrumented code is running on. Luckily I know the timezone, since this ran on my laptop, which is set to Timezone EDT (Eastern Daylight Time, UTC -0400).

Because date/time data is a key datatype, Fusion provides a Date Parsing index stage, which parses and normalizes date/time data in document fields. Therefore, to fix this problem, I add a Date Parsing stage to index pipeline “MyFusionLogfiles-default”, where I specify the source field as “log4j_timestamp_tdt”, the date format as “yyyy-MM-dd’T’HH:mm:ss,SSS”, and the timezone as “EDT”:

Date Parsing index stage

This stage must come before the Solr Indexer stage. In the Fusion UI, adding a new stage to a pipeline puts it at the end of the pipeline, so I need to reorder the pipeline by dragging the Date Parsing stage so that it precedes the Solr Indexer stage.

Once this change is in place, I clear both the collection and the datasource and re-run the indexing job. An annoying detail for the Logstash connector is that in order to clear the datasource, I need to track down the Logstash “since_db” files on disk, which track the last line read in each of the Logstash input files, (known issue, CONN-881). On my machine, I find a trio of hidden files in my home directory, with names that start with “.sincedb_” and followed by ids like “1e63ae1742505a80b50f4a122e1e0810″, and delete them.

Problem solved! A wildcard search over all documents in collection “MyFusionLogfiles” shows that the set of document fields includes “log4j_timestamp_tdt” field, along with several fields added by the Date Parsing index stage:

MyFusionLogs documents - 2

Lessons Learned

More than 90% of data analytics is data munging, because the data never fits together quite as cleanly as it ought to.

Once you accept this fact, you will appreciate the power and flexibility of Fusion Pipeline index stages and the power and convenience of the tools on the Fusion UI.

Fusion Log Analytics with Fusion

Fusion Dashboards provide interactive visualizations over your data. This is a reprise of the information in my previous post on Log Analytics with Fusion, which used a small CSV file of cleansed server-log data. Now that I’ve got three logfile’s worth of data, I’ll create a similar dashboard.

The Fusion Dashboards tool is the rightmost icon on the Fusion UI launchpad page. It can be accessed directly as: http://localhost:8764/banana/index.html#/dashboard. When opened from the Fusion launchpad, the Dashboards tool displays in a new tab labeled “Banana 3″. Time-series dashboards show trends over time by using the timestamp field to aggregate query results. To create a time-series dashboard over the collection “MyFusionLogfiles” I click on the new page icon in the upper right-hand corner of top menu, and choose to create a new time-series dashboard, specifying “MyFusionLogfiles” as the collection, and “log4j_timestamp_tdt” as the field. I modify the default time-series dashboard, again, by adding a pie chart that shows the breakdown of logging events by priority:

MyFusionLogs dashboard

Et voilà! It all just works!

The post Data Analytics using Fusion and Logstash appeared first on Lucidworks.

Lucidworks Fusion Now Available in AWS Marketplace

$
0
0
While it’s been easy to download and install Fusion on your own machine, we’ve worked with Amazon Web Services to offer it pre-installed on Amazon Machine Images, so it’s even easier to trial or get started using Fusion. If you don’t have easy access to a machine with the recommended OS, disk space, or memory, you can launch an instance of Fusion in the AWS cloud and have it running on a suitably configured system with just one click. lucidworks-fusion-aws We are offering two editions of Fusion in the AWS Marketplace. Both editions run the same software, but are offered under different terms and usage scenarios:
  • The Lucidworks Fusion demo is available without any software fees. It will only run on selected sizes of AWS EC2 hardware. You can use this edition to experiment with features and functionality of Fusion. Support is not offered on this version.
  • The Lucidworks Fusion standard server is intended for production use and is offered at hourly or annual rates. It is available on a wider variety of more powerful hardware, allowing you to use Fusion at larger scales. Importantly, this edition also includes standard product support to provide assurance to your production deployment.
If you haven’t had the chance to try out Fusion, here’s one more option to get you up and running, and see how you can use it to create powerful search-based applications.

The post Lucidworks Fusion Now Available in AWS Marketplace appeared first on Lucidworks.

Query Autofiltering Extended – On Language and Logic in Search

$
0
0
Spock: The logical thing for you to have done was to have left me behind. McCoy: Mr. Spock, remind me to tell you that I’m sick and tired of your logic.
This is the third in a series of blog posts on a technique that I call Query Autofiltering – using the knowledge built into the search index itself to do a better job of parsing queries and therefore giving better answers to user questions. The first installment set the stage by arguing that a better understanding of language and how it is used when users formulate queries, can help us to craft better search applications – especially how adjectives and adverbs – which can be thought of as attributes or properties of subject or action words (nouns and verbs) – should be made to refine rather than to expand search results – and why the OOTB search engine doesn’t do this correctly. Solving this at the language level is a hard problem. A more tractable solution involves leveraging the descriptive information that we may have already put into our search indexes for the purposes of navigation and display, to parse or analyze the incoming query. Doing this enables us to produce results that more closely match the user’s intent. The second post describes an implementation approach using the Lucene FieldCache that can automatically detect when terms or phrases in a query are contained in metadata fields and to then use that information to construct more precise queries. So rather than searching and then navigating, the user just searches and finds (even if they are not feeling lucky). An interesting problem developed from this work – what to do when more than one term in a query matches the same metadata field? It turns out that the answer is one of the favorite phrases of software consultants – “It Depends”. It depends on whether the field is single or multi valued. Understanding why this is so leads to a very interesting insight – logic in language is not ambiguous, it is contextual, and part of the context is knowing what type of field we are talking about. Solving this enables us to respond correctly to boolean terms (“and” and “or”) in user queries, rather than simply ignoring them (by treating them as stop words) as we typically do now.

Logic in Mathematics vs Logic in Language

Logic is of course fundamental to both mathematics and language. It is especially important in computer engineering as it forms the operational basis of the digital computer. Another area where logic reigns is Set Theory – the mathematics of groups – and it is in this arena where language and search collide because search is all about finding a set of documents that match a given query (sets can have zero or more elements in them). When we focus on the mathematical aspects of sets, we need to define precise operators to manipulate them – intersection, union, exclusion – AND, OR, NOT, etc. Logic in software needs to be explicit or handled with global defaults. Logic in language is contextual – it can be implicit or explicit. An example of implied logic is in the use of adjectives as refiners such as the “red sofa” example that I have been using. Here, the user is clearly looking for things that are sofas AND are red in color. If the user asks for “red or blue sofas”, there are two logical operators, one implied and one explicit – they want to see sofas that are either red or blue. But what if the user asks for “red and blue sofas”? They could be asking to see sofas in both colors if referring to sets, or to individual sofas that have both red and blue in them. So this is somewhat ambiguous because the refinement field “color” is not clearly defined yet – can a single sofa have more than one color or just one? Lets choose something that is definitely single-valued – size. If I say “show me large or extra-large t-shirts” the language use of logic is the same as the mathematical one but if I say “show me large and extra-large t-shirts” it is not. Both of these phrases in language mean the same thing because we instinctively understand that a single shirt has only one size so if we use “and” we mean “show me shirts in both sizes” and for “or” we mean “show me shirts of either size” which in terms of set theory translates to the same operation – UNION or OR. In other words, “and” and “or” are synonyms in this context! For search, only OR can be supported for single-value fields because using AND gives the non result – zero records. The situation is not the same when dealing with attributes for which a single entity can have more than one value. If I say, “show me shirts that are soft, warm and machine-washable” then I mean intersection of these attributes – I only want to see shirts that have all of these qualities. But if I say “show me shirts that are comfortable or lightweight” I expect to see shirts with at least one of these attributes, or in other words the union of comfortable and lightweight shirts. “And” and “or” are now antonyms as they are in mathematics and computer science. It also makes sense from a search perspective because we can use either AND or OR in the context of a multi-value field and still get results. Getting back to implied vs. explicit, it is AND that is implied in this case because I can say “show me soft, warm, machine-washable shirts” which means the same as “soft, warm and machine-washable shirts”. So we conclude that how the vernacular use of “and” and “or” should be interpreted depends on whether the values for that attribute are exclusive or not (i.e. single or multi-valued). That is, “and” means “both” (or “all” if more than two values are given) and “or” means “either” (or “any”, respectively). For “and” if the attribute is single valued we mean “show me both things”, if it is multi-valued we mean “show me things with both values”. For “or”, single valued attributes translate to “show me either thing” and if multi-valued “show me things with either value”.  As Mr. Spock would say, its totally logical (RIP Leonard – we’ll miss you!)

Implementing Contextual Logic in Search

Armed with a better understanding of how logic works in language and how that relates to the mathematics of search operations, we can do a better job of responding to implied or explicit logic embedded in search queries – IF – we know how terms map to fields and what type of fields they map to. It turns out that the Query Autofiltering component can give us this context – it uses the Lucene FieldCache to create a map of field values to field names – and once it knows what field a part of the query maps to, it knows whether that field is single or multi-valued.  So given this, if there is more than one value for a given field in a query, and that field is single valued, we always use OR. If the field is multi-valued then we use AND if no operator is specified and OR if “or” is used within the positional context of the set of field values.  In other words, we see if the term “or” occurs somewhere between the first and last instances of a particular field value such as in “lightweight or comfortable”. This also allows us to handle phrases that have multiple logical operators such as “soft, warm, machine-washable shirts that come in red or blue”.  Here the “or” does not override the multi-valued attribute list’s implied “and” because it is outside of the list. It instead refers to values of color – which if a single value field in the index is ignored and defaults to OR. Here is the code that does this contextual interpretation. As the sub-phrases in the query are mapped to index fields, the first and last positions of the phrase set are captured. Then if the field is multi-valued, AND is used unless the term “or” has been interspersed:
  SolrIndexSearcher searcher = rb.req.getSearcher();
  IndexSchema schema = searcher.getSchema();
  SchemaField field = schema.getField( fieldName );

  boolean useAnd = field.multiValued() && useAndForMultiValuedFields;
  // if query has 'or' in it and or is at a position
  // 'within' the values for this field ...
  if (useAnd) {
    for (int i = termPosRange[0] + 1; i < termPosRange[1]; i++ ) {
      String qToken = queryTokens.get( i );
      if (qToken.equalsIgnoreCase( "or" )) {
        useAnd = false;
        break;
      }
    }
  }

  StringBuilder qbldr = new StringBuilder( );
  for (String val : valList ) {
    if (qbldr.length() > 0) qbldr.append( (useAnd ? " AND " : " OR ") );
    qbldr.append( val );
  }

  return fieldName + ":(" + qbldr.toString() + ")" + suffix;
The full source code for the QueryAutofilteringComponent is available on github for both Solr 4.x and Solr 5.x. (Due to API changes introduced in Solr 5.0, two versions of this code are needed.)

Demo

To show these concepts in action, I created a sample data set for a hypothetical department store (available on the github site). The input data contains a number of fields, product_type, product_category, color, material, brand, style, consumer_type and so on. Here are a few sample records:
  <doc>
    <field name="id">17</field>
    <field name="product_type">boxer shorts</field>
    <field name="product_category">underwear</field>
    <field name="color">white</field>
    <field name="brand">Fruit of the Loom</field>
    <field name="consumer_type">mens</field>
  </doc>
  . . .
  <doc>
    <field name="id">95</field>
    <field name="product_type">sweatshirt</field>
    <field name="product_category">shirt</field>
    <field name="style">V neck</field>
    <field name="style">short-sleeve</field>
    <field name="brand">J Crew Factory</field>
    <field name="color">grey</field>
    <field name="material">cotton</field>
    <field name="consumer_type">womens</field>
  </doc>  
  . . .
  <doc>
    <field name="id">154</field>
    <field name="product_type">crew socks</field>
    <field name="product_category">socks</field>
    <field name="color">white</field>
    <field name="brand">Joe Boxer</field>
    <field name="consumer_type">mens</field>
  </doc>
  . . .
  <doc>
    <field name="id">135</field>
    <field name="product_type">designer jeans</field>
    <field name="product_category">pants</field>
    <field name="brand">Calvin Klein</field>
    <field name="color">blue</field>
    <field name="style">pre-washed</field>
    <field name="style">boot-cut</field>
    <field name="consumer_type">womens</field>
  </doc>
The dataset contains built-in ambiguities in which a single token can occur as part of a product type, brand name, color or style. Color names are good examples of this but there are others (boxer shorts the product vs Joe Boxer the brand).  The ‘style’ field is multi-valued. Here is the schema.xml definitions of the fields:
  
  <field name="brand"        type="string" indexed="true" stored="true" multiValued="false" />
  <field name="color"        type="string" indexed="true" stored="true" multiValued="false" />
  <field name="colors"       type="string" indexed="true" stored="true" multiValued="true" />
  <field name="material"     type="string" indexed="true" stored="true" multiValued="false" />
  <field name="product_type" type="string" indexed="true" stored="true" multiValued="false" />
  <field name="product_category" type="string" indexed="true" stored="true" multiValued="false" />
  <field name="consumer_type" type="string" indexed="true" stored="true" multiValued="false" />
  <field name="style"         type="string" indexed="true" stored="true" multiValued="true" />
  <field name="made_in"       type="string" indexed="true" stored="true" multiValued="false" />
To make these string fields searchable from a “freetext” – box-and-a-button query (e.g. q=red socks ), the data is copied to the catch-all text field ‘text':
  
  <copyField source="color" dest="text" />
  <copyField source="colors" dest="text" />
  <copyField source="brand" dest="text" />
  <copyField source="material" dest="text" />
  <copyField source="product_type" dest="text" />
  <copyField source="product_category" dest="text" />
  <copyField source="consumer_type"  dest="text" />
  <copyField source="style"  dest="text" />
  <copyField source="made_in"  dest="text" />
The solrconfig file has these additions for the QueryAutoFilteringComponent and a request handler that uses it:
  
  <requestHandler name="/autofilter" class="solr.SearchHandler">
    <lst name="defaults">
      <str name="echoParams">explicit</str>
      <int name="rows">10</int>
      <str name="df">description</str>
    </lst>
     
    <arr name="first-components">
      <str>queryAutofiltering</str>
    </arr>
  </requestHandler>

  <searchComponent name="queryAutofiltering" class="org.apache.solr.handler.component.QueryAutoFilteringComponent" />
Example 1: “White Linen perfume” There are many examples of this query problem in the data set where a term such as “white” is ambiguous because it can occur in a brand name and as a color, but this one has two ambiguous terms “white” and “linen” so it is a good example of how the autofiltering parser works. The phrase “White Linen” is known from the dataset to be a brand and “perfume” maps to a product type, so the basic autofiltering algorithm would match “White” as a color, then reject that for “White Linen” as a brand – since it is a longer match. It will then correctly find the item “White Linen perfume”.  However, what if I search for “white linen shirts”? In this case, the simple algorithm won’t match because it will fail to provide the alternative parsing “color:white AND material:linen”. That is, now the phrase “White Linen” is ambiguous. In this case, an additional bit of logic is applied to see if there is more than one possible parsing of this phrase, so in this case, the parser produces the following query:
((brand:"White Linen" OR (color:white AND material:linen)) AND product_category:shirts)
Since there are no instances of shirts made by White Linen (and if there were, the result would still be correct), we just get shirts back. Similarly for the perfume, since perfume made from linen doesn’t exist, we only get the one product. That is, some of the filtering here is done in the collection. The parser doesn’t know what makes “sense” at the global level and what doesn’t, but the dataset does – so between the two, we get the right answer. Example 2: “white and grey dress shirts” In this case, I have created two color fields, “color” which is used for solid-color items and is single valued and “colors” which is used for multicolored items (like striped or patterned shirts) and is multi valued.  So if I have dress shirts in the data set that are solid-color white and solid-color grey and also striped shirts that are grey and white stripes and I search for “white and grey dress shirts”, my intent is interpreted by the autofiltering parser as “show me solid-color shirts in both white and grey or multi-colored shirts that have both white and grey in them”. This is the boolean query that it generates:
((product_type:"dress shirt" OR ((product_type:dress OR product_category:dress) 
AND (product_type:shirt OR product_category:shirt))) 
AND (color:(white OR grey) OR colors:(white AND grey)))
(Note that it also creates a redundant query for dress and shirt since “dress” is also a product type – but this query segment returns no results since no item is both a “dress” and a “shirt” – so it is just a slight performance waster). If I don’t want the solid colors, I can search for “striped white and grey dress shirts” and get just those items ( or use the facets). (We could also have a style like “multicolor” vs “solid color” to disambiguate but that may not be too intuitive.) In this case, the query that the autofilter generates looks like this:
((product_type:"dress shirt" OR ((product_type:dress OR product_category:dress) 
AND (product_type:shirt OR product_category:shirt))) 
AND (color:(white OR grey) OR colors:(white AND grey)) 
AND style:striped)
Suffice it to say that the out-of-the-box /select request handler doesn’t do any of this. To be fair, it does a good job of relevance ranking for these examples, but its precision (percentage of true or correct positives) is very poor. You can see this by comparing the number of results that you get with the /select handler vs. the /autofilter handler – in terms of precision, its night and day. But is this dataset “too contrived” to be of real significance? For eCommerce data, I don’t think so, many of these examples are real-world products and marketing data is rife with ambiguities that standard relevance algorithms operating at the single token level simply can’t address. The autofilter deals with ambiguity by noting that phrases tend to be less ambiguous than terms, but goes further by providing alternate parsing when the phrase is ambiguous. We want to remove ambiguities that stem from the tokenization that we do on the documents and queries – we cannot remove real ambiguities, rather we need to respond to them appropriately.

Performance considerations:

On the surface it would appear that the Query Autofiltering component adds some overhead to the query parsing process – how much is a matter for further research on my part – but lets look at the potential cost-benefit analysis. Increasing the precision of search results helps both in terms of result quality and performance, especially with very large datasets because two of the most expensive things that a search engine has to do are sorting and faceting. Both of these require access to the full result set, so fewer false positives means fewer things to sort (i.e. demote) and facet – and overall faster responses. And while relevance ranking can push false positives off of the first page (or shove them under the rug so to speak), the faceting engine cannot – it shows all.  In some examples shown here, the precision gains are massive – in some cases an order of magnitude better. On very large datasets, one would expect that to have a significant positive impact on performance.

Autofiltering vs. Autophrasing

Awhile back, I introduced another solution for dealing with phrases and handling multi-term synonyms called “autophrasing” (1,2). What is the difference between these two things? They basically do the same thing – handle noun phrases as single things, but use different methods and different resources. Both can solve the multi-term synonym problem. The autophrasing solution requires an additional metadata file “autophrases.txt” that contains a list of multi-word terms that are used to represent singular entities. The autofiltering solution gets this same information from collection fields so that it doesn’t need this extra file. It can also work across fields and can solve other problems such as converting colloquial logic to search engine logic as discussed in this post. In contrast, the autophrasing solution lacks this “relational context” – it knows that a phrase represents a single thing, but it doesn’t know what type of thing it is and how it relates to other things. Therefore, it can’t know what to do when user queries contain logical semantic constructs that cross field boundries. So, if there already is structured information in your index, which is typically the case for eCommerce data, use autofiltering. Autophrasing is more appropriate when you don’t have structured information – as with record sets that have lots of text in them (bibliographic) – and you simply want phrase disambiguation. Or, you can generate the structured data needed for autofiltering by categorizing your content using NLP or taxonomic approaches. The choice of categorization method may be informed by the need to have this “relational context” that I spoke about above. Taxonomic tagging can give this context – a taxonomy can “know” things about terms and phrases like what type of entities that they represent. This gives it an advantage over machine learning classification techniques where term relationships and interrelationships are statistically rather than semantically defined. For example, if I am crawling documents on software technology and encounter the terms “Cassandra”, “Couchbase”, “MongoDB”, “Neo4J”, “OrientDB” and NoSQL DB”, both machine learning and taxonomic approaches can determine/know that these terms are related. However, the taxonomy understands the difference between a term that represents a class or type of thing (“NoSQL DB”) and an instance of a class/type (“MongoDB”) where as an ML classifier would not – it learns that they are related but not how those relationships are structured, semantically speaking.  The taxonomy would also know that “Mongo” is a synonym for “MongoDB”. It is doubtful that an ML algorithm would get that.  This is a critical aspect for autofiltering because it needs to know both what sets of tokens constitute a phrase and also what those phrases represent. Entity extraction techniques can also be used – regular expression, person, company, location extractors – that associate a lexical pattern with a metadata field value.  Gazetteer or white-list entity extractors can do the same thing for common phrases that need to be tagged in a specific way. Once this is done, autofiltering can apply all of this effort to the query, to bring that discovered context to the sharp tip of the spear – search-wise.  Just as we traditionally apply the same token analysis in Lucene/Solr to both the query and the indexed documents, we can do the same with classification technologies. So it is not that autofiltering can replace traditional classification techniques – these typically work on the document where there is a lot of text to process. Autofiltering can leverage this effort because it works on the query where there is not much text to work with. Time is also of the essence here. We can’t afford to use expensive text crunching algorithms as we do when we index data (well … sort of), because in this case we are dealing with what I call HTT – Human Tolerable Time. Expect a blog post on this in the near future.

The post Query Autofiltering Extended – On Language and Logic in Search appeared first on Lucidworks.

What’s new in Apache Solr 5.2

$
0
0
Apache Lucene and Solr 5.2.0 were just released with tons of new features, optimizations, and bug fixes. Here are the major highlights from the release:

Rule based replica assignment

This feature allows users to have fine grained control on placement of new replicas during collection, replica, and shard creation. A rule is a set of conditions, comprising of shard, replica, and a tag that must be satisfied before a replica can be created. This can be used to restrict replica creations like:
  • Keep less than 2 replicas of a collection on any node
  • For a shard, keep less than 2 replicas on any node
  • (Do not) Create shards on a particular rack, or host.
More details about this feature are available in this blogpost : https://lucidworks.com/blog/rule-based-replica-assignment-solrcloud/

Restore API

So far, Solr provided with a feature to back-up an existing index using a call like: http://localhost:8983/solr/techproducts/replication?command=backup&name=backup_name The new restore API allows you to restore an existing back-up via a command like: http://localhost:8983/solr/techproducts/replication?command=restore&name=backup_name The location of the index backup defaults to the data directory but can be overriden by the location parameter.

JSON Facet API

unique() facet function

The unique facet function is now supported for numeric and date fields. Example:
json.facet={
  unique_products : "unique(product_type)"
}

The “type” parameter: flatter request

There’s now a way to construct a flatter JSON Facet request using the “type” parameter. The following request from 5.1:
top_authors : {
  terms : { 
    field:author, 
    limit:5 
  }
}
is equivalent to this request in 5.2:
top_authors : { 
  type:terms,
  field:author,
  limit:5 
}

mincount parameter and range facets

The mincount parameter is now supported by range facets to filter out ranges that don’t meet a minimum document count. Example:
prices:{ 
  type:range,
  field:price,
  mincount:1,
  start:0,
  end:100,
  gap:10
}

multi-select faceting

A new parameter, excludeTags will disregards any matching tagged filters for that facet. Example:
q=cars
&fq={!tag=COLOR}color:black
&fq={!tag=MODEL}model:xc90
&json.facet={
    colors:{type:terms, field:color, excludeTags=COLOR},
    model:{type:terms, field:model, excludeTags=MODEL} 
  }
The above example shows a request where a user selected “color:black”. This query would do the following:
  • Get a document list with the filter applied.
  • colors facet:
    • Exclude the color filter so you get back facets for all colors instead of just getting the color ‘black’.
    • Apply the model filter.
  • Similarly compute facets for the model i.e. exclude the model filter but apply the color filter.

hll facet function

The json facet API has an option to use the HyperLogLog implementation for computing unique values. Example:
json.facet={
  unique_products : "hll(product_type)"
}

Choosing facet implementation

Pre Solr 5.2, interval faceting had a different implementation than range faceting based on DocValues, which at times is faster and doesn’t rely on filters and filter-cache. Solr 5.2 has support to choose between the Filters and DocValues based implementations. Functionally, the results of the two are the same, but there could be a difference in performance. The facet.range.method parameter allows for specifying the implementation to be used. Some numbers on the performance of the two methods can be found here: https://issues.apache.org/jira/browse/SOLR-7406?focusedCommentId=14497338&page=com.atlassian.jira.plugin.system.issuetabpanels:comment-tabpanel#comment-14497338

Stats component

Solr stats component now has support for HyperLogLog based cardinality estimation. The same is also used by the new Json facet API. The cardinality option uses probabilistic “HyperLogLog” (HLL) algorithm to estimate the cardinality of the sets in a fixed amount of memory. It also allows for tuning the cardinality parameter, which allows you to trade off accuracy for the amount of RAM used at query time, with relatively minor impacts on response time performance. More about this can be read here: https://lucidworks.com/blog/hyperloglog-field-value-cardinality-stats/

Solr security

SolrCloud allows for hosting multiple collections within the same cluster but until 5.1, didn’t provide a mechanism to restrict access. The authentication framework in 5.2 allows for plugging in a custom authentication plugin or using the Kerberos plugin that is shipped out of the box. This allows for authenticating requests to Solr. The authorization framework allows for implementing a custom plugin to authorize access for resources in a SolrCloud cluster. Here’s a Solr reference guide link for the same: https://cwiki.apache.org/confluence/display/solr/Security

Solr streaming expressions

Streaming Expressions, provide a simple query language for SolrCloud that merges search with parallel computing. This builds on the Solr streaming API introduced in 5.1. The Solr reference guide has more information about the same: https://cwiki.apache.org/confluence/display/solr/Streaming+Expressions

Other features

A few configurations in Solr need to be in place as part of the bootstrapping process and before the first Solr node comes up e.g. to enable SSL. The CLUSTERPROP call provides with an API to do so, but requires a running Solr instance. Starting Solr 5.2, a cluster-wide property can be added/edited/deleted using the zkcli script and doesn’t require a running Solr instance. On the spatial front, this release introduces the new spatial RptWithGeometrySpatialField, based on CompositeSpatialStrategy, which blends RPT indexes for speed with serialized geometry for accuracy. It includes a Lucene segment based in-memory shape cache. There is now a refactored Admin UI built using AngularJS. This new UI isn’t the default, but an optional UI interface so users could report issues and provide feedback for this to migrate and become the default UI. The new UI can be accessed at: http://hostname:port/solr/index.html Though it’s an internal detail but it’s certainly an important one. Solr has internally been upgraded to use Jetty 9. This allows us to move towards using Async calls and more.

Indexing performance improvement

This release also comes with a substantial indexing performance improvement and bumps it up by almost 100% as compared to Solr 4x. Watch out for a blog on that real soon.   Beyond the features and improvements listed above, Solr 5.2.0 also includes many other new features as well as numerous optimizations and bugfixes of the corresponding Apache Lucene release. For more information, the detailed change log for both Lucene and Solr can be found here: Lucene: http://lucene.apache.org/core/5_2_0/changes/Changes.html Solr: http://lucene.apache.org/solr/5_2_0/changes/Changes.html Featured image by David Precious

The post What’s new in Apache Solr 5.2 appeared first on Lucidworks.


Indexing Performance in Solr 5.2 (now twice as fast)

$
0
0
About this time last year (June 2014), I introduced the Solr Scale Toolkit and published some indexing performance metrics for Solr 4.8.1. Solr 5.2.0 was just released and includes some exciting indexing performance improvements, especially when using replication. Before we get into the details about what we fixed, let’s see how things have improved empirically. Using Solr 4.8.1 running in EC2, I was able to index 130M documents into a collection with 10 shards and replication factor of 2 in 3,727 seconds (~62 minutes) using ten r3.2xlarge instances; please refer to my previous blog post for specifics about the dataset. This equates to an average throughput of 34,881 docs/sec. Today, using the same dataset and configuration, with Solr 5.2.0, the job finished in 1,704 seconds (~28 minutes), which is an average 76,291 docs/sec. To rule out any anomalies, I reproduced these results several times while testing release candidates for 5.2. To be clear, the only notable difference between the two tests is a year of improvements to Lucene and Solr! So now let’s dig into the details of what we fixed. First, I cannot stress enough how much hard work and sharp thinking has gone into improving Lucene and Solr over the past year. Also, special thanks goes out to Solr committers Mark Miller and Yonik Seeley for helping identify the issues discussed in this post, recommending possible solutions, and providing oversight as I worked through the implementation details. One of the great things about working on an open source project is being able to leverage other developers’ expertise when working on a hard problem. Too Many Requests to Replicas One of the key observations from my indexing tests last year was that replication had higher overhead than one would expect. For instance, when indexing into 10 shards without replication, the test averaged 73,780 docs/sec, but with replication, performance dropped to 34,881. You’ll also notice that once I turned on replication, I had to decrease the number of Reducer tasks (from 48 to 34) I was using to send documents to Solr from Hadoop to avoid replicas going into recovery during high-volume indexing. Put simply, with replication enabled, I couldn’t push Solr as hard. When I started digging into the reasons behind replication being expensive, one of the first things I discovered is that replicas receive up to 40x the number of update requests from their leader when processing batch updates, which can be seen in the performance metrics for all request handlers on the stats panel in the Solr admin UI. Batching documents into a single request is a common strategy used by client applications that need high-volume indexing throughput. However, batches sent to a shard leader are parsed into individual documents on the leader, indexed locally, and then streamed to replicas using ConcurrentUpdateSolrClient. You can learn about the details of the problem and the solution in SOLR-7333. Put simply, Solr’s replication strategy caused CPU load on the replicas to be much higher than on the leaders, as you can see in the screenshots below. CPU Profile on Leader leader_cpu CPU Profile on Replica (much higher than leader) replica_cpu Ideally, you want all servers in your cluster to have about the same amount of CPU load. The fix provided in SOLR-7333, helps reduce the number of requests and CPU load on replicas by sending more documents from the leader per request when processing a batch of updates. However, be aware that the batch optimization is only available when using the JavaBin request format (the default used by CloudSolrClient in SolrJ); if your indexing application sends documents to Solr using another format (JSON or XML), then shard leaders won’t utilize this optimization when streaming documents out to replicas. We’ll likely add a similar solution for processing other formats in the near future. Version Management Lock Contention Solr adds a _version_ field to every document to support optimistic concurrency control. Behind the scenes, Solr’s transaction log uses an array of version “buckets” to keep track of the highest known version for a range of hashed document IDs. This helps Solr detect if an update request is out-of-date and should be dropped. Mark Miller ran his own indexing performance tests and found that expensive index housekeeping operations in Lucene can stall a Solr indexing thread. If that thread happens to be holding the lock on a version bucket, it can stall other threads competing for the lock. To address this, we increased the default number of version buckets used by Solr’s transaction logs from 256 to 65536, which helps reduce the number of concurrent requests that are blocked waiting to acquire the lock on a version bucket. You can read more about this problem and solution in SOLR-6820. We’re still looking into how to deal with Lucene using the indexing thread to performance expensive background operations but for now, it’s less of an issue. Expensive Lookup for a Document’s Version When adding a new document, the leader sets the _version_ field to a long value based on the CPU clock time; incidentally, you should use a clock synchronization service for all servers in your Solr cluster. Using the YourKit profiler, I noticed that replicas spent a lot of time trying to lookup the _version_ for new documents to ensure update requests were not re-ordered. Specifically, the expensive code was where Solr attempts to find the internal Lucene ID for a given document ID. Of course for new documents, there is no existing version, so Solr was doing a fair amount of wasted work looking for documents that didn’t exist. Yonik pointed out that if we initialize the version buckets used by the transaction log to the maximum value of the _version_ field before accepting new updates, then we can avoid this costly lookup for every new document coming into the replica. In other words, if a version bucket is seeded with the max value from the index, then when new documents arrive with a version value that is larger than the current max, we know this update request has not been reordered. Of course the max version for each bucket gets updated as new documents flow into Solr. Thus, as of Solr 5.2.0, when a Solr core initializes, it seeds version buckets with the highest known version from the index, see SOLR-7332 for more details. With this fix, when a replica receives a document from its leader, it can quickly determine if the update was reordered by consulting the highest value of the version bucket for that document (based on a hash of the document ID). In most cases, the version on an incoming document to a replica will have a higher value than the version bucket, which saves an expensive lookup to the Lucene index and increases overall throughput on replicas. If by chance, the replica sees a version that is lower than the bucket max, it will still need to consult the index to ensure the update was not reordered. These three tickets taken together achieve a significant increase in indexing performance and allows us to push Solr harder now. Specifically, I could only use 34 reducers with Solr 4.8.1 but was able to use 44 reducers with 5.2.0 and still remain stable. Lastly, if you’re wondering what you need to do to take advantage of these fixes, you only need to upgrade to Solr 5.2.0, no additional configuration changes are needed. I hope you’re able to take advantage of these improvements in your own environment and please file JIRA requests if you have other ideas on how to improve Solr indexing performance. The Solr Scale Toolkit has been upgraded to support Solr 5.2.0 and the dataset I used is publicly shared on S3 if you want to reproduce these results.

The post Indexing Performance in Solr 5.2 (now twice as fast) appeared first on Lucidworks.

Top 5 Open Source Natural Language Processing Libraries

$
0
0
Lucidworks CTO Grant Ingersoll’s latest column on Opensource.com gives you a rundown on five of the most popular and powerful open source projects for taming text and processing natural language in both queries and indexing. Highlights projects from Stanford and the Apache Software Foundation:

“Thankfully, open source is chock full of high-quality libraries to solve common problems in text processing like sentiment analysis, topic identification, automatic labeling of content, and more. More importantly, open source also provides many building block libraries that make it easy for you to innovate without having to reinvent the wheel. If all of this stuff is giving you flashbacks to your high school grammar classes, not to worry—we’ve included some useful resources at the end to brush up your knowledge as well as explain some of the key concepts around natural language processing (NLP). To begin your journey, check out these projects.

Read all of Grant’s columns on Opensource.com or follow him on Twitter.

The post Top 5 Open Source Natural Language Processing Libraries appeared first on Lucidworks.

Fusion 2.0 Now Available – Now With Apache Spark!

$
0
0
I’m really excited today to announce that we’ve released Lucidworks Fusion 2.0! Of course, this a new major release, and as such there is some big changes from previous versions: New User Experience The most visible change is a completely new user interface. In Fusion 2.0, we’ve re-thought and re-designed the UI workflows. It’s now easier to create and configure Fusion, especially for users who are not familiar with Fusion and Solr architecture. Along with the new workflows, there’s a redesigned look and several convenience and usability improvements. image01 Another part of the UI that has been rebuilt is the Silk dashboard system. While the previous Silk/Banana framework was based on Kibana 3, we’ve updated to a new Silk dashboard framework based on Kibana 4. image00 Hierarchical facet management is now included. This lets administrators or developers change how search queries return data, depending on where and how a user is browsing results. The most straightforward use of this is to select different facets and fields according to (for example) the category or section that user is looking at. And More Along with this all-new front-end, the back-end of Fusion has been making less prominent but important incremental performance and stability improvements, especially around our integrations with external security systems like Kerberos and Active Directory and Sharepoint. We’ve already been supporting Solr 5.x, and In Fusion 2.0, we’re also shipping with Solr 5.x built-in. (We continue to support Solr 4.x versions as before.) And again as always, we’re putting down foundations for more exciting features around Apache Spark processing, deep learning, and system operations. But that’s for another day. While I’m very proud of this release and could go on at greater length about it, I’ll instead encourage you to try it out yourself. Read the release notes.
Coverage in Silicon Angle:
“LucidWorks Inc. has added integration with the speedy data crunching framework in the new version of its flagship enterprise search engine that debuted this morning as part of an effort to catch up with the changing requirements of CIOs embarking on analytics projects. .. That’s thanks mainly to its combination of speed and versatility, which Fusion 2.0 harnesses to try and provide more accurate results for queries run against unstructured data. More specifically, the software – a commercial implementation of Solr, one of the most popular open-source search engines for Hadoop, in turn the de facto storage backend for Spark – uses the project’s native machine learning component to help hone the relevance of results.”
Coverage in Software Development Times:
Fusion 2.0’s Spark integration within its data-processing layer enables real-time analytics within the enterprise search platform, adding Spark to the Solr architecture to accelerate data retrieval and analysis. Developers using Fusion now also have access to Spark’s store of machine-learning libraries for data-driven analytics. “Spark allows users to leverage real-time streams of data, which can be accessed to drive the weighting of results in search applications,” said Lucidworks CEO Will Hayes. “In regards to enterprise search innovation, the ability to use an entirely different system architecture, Apache Spark, cannot be overstated. This is an entirely new approach for us, and one that our customers have been requesting for quite some time.”
Press release on MarketWired.

The post Fusion 2.0 Now Available – Now With Apache Spark! appeared first on Lucidworks.

Search Basics for Data Engineers

$
0
0

Lucidworks Fusion is a platform for data engineering, built on Solr/Lucene, the Apache open source search engine, which is fast, scalable, proven, and reliable. Fusion uses the Solr/Lucene engine to evaluate search requests and return results in the form of a ranked list of document ids. It gives you the ability to slice and dice your data and search results, which means that you can have Google-like search over your data, while maintaining control of both your data and the search results.

The difference between data science and data engineering is the difference between theory and practice. Data engineers build applications given a goal and constraints. For natural language search applications, the goal is to return relevant search results given an unstructured query. The constraints include: limited, noisy, and/or downright bad data and search queries, limited computing resources, and penalties for returning irrelevant or partial results.

As a data engineer, you need to understand your data and how Fusion uses it in search applications. The hard part is understanding your data. In this post, I cover the key building blocks of Fusion search.

Fusion Key Concepts

Fusion extends Solr/Lucene functionality via a REST-API and a UI built on top of that REST-API. The Fusion UI is organized around the following key concepts:

  • Collections store your data.
  • Documents are the things that are returned as search results.
  • Fields are the things that are actually stored in a collection.
  • Datasource are the conduit between your data repository and Fusion.
  • Pipelines encapsulate a sequence of processing steps, called stages.
    • Indexing Pipelines process the raw data received from a datasource into fielded documents for indexing into a Fusion collection.
    • Query Pipelines process search requests and return an ordered list of matching documents.
  • Relevancy is the metric used to order search results. It is a non-negative real number which indicates the similarity between a search request and a document.

Lucene and Solr

Lucene started out as a search engine designed for following information retrieval task: given a set of query terms and a set of documents, find the subset of documents which are relevant for that query. Lucene provides a rich query language which allows for writing complicated logical conditions. Lucene now encompasses much of the functionality of a traditional DBMS, both in the kinds of data it can handle and the transactional security it provides.

Lucene maps discrete pieces of information, e.g., words, dates, numbers, to the documents in which they occur. This map is called an inverted index because the keys are document elements and the values are document ids, in contrast to other kinds of datastores where document ids are used as a key and the values are the document contents. This indexing strategy means that search requires just one lookup on an inverted index, as opposed to a document oriented search which would require a large number of lookups, one per document. Lucene treats a document as a list of named, typed fields. For each document field, Lucene builds an inverted index that maps field values to documents.

Lucene itself is a search API. Solr wraps Lucene in an web platform. Search and indexing are carried out via HTTP requests and responses. Solr generalizes the notion of a Lucene index to a Solr collection, a uniquely named, managed, and configured index which can be distributed (“sharded”) and replicated across servers, allowing for scalability and high availability.

Fusion UI and Workflow

The following sections show how the above set of key concepts are realized in the Fusion UI.

Collections

Fusion collections are Solr collections which are managed by Fusion. Fusion can manage as many collections as you need, want, or both. On initial login, the Fusion UI prompts you to choose or create a collection. On subsequent logins, the Fusion UI displays an overview of your collections and system collections:

Fusion collections panel

The above screenshot shows the Fusion collections page for an initial developer installation, just after initial login and creation of a new collection called “my_collection”, which is circled in yellow. Clicking on this circled name leads to the “my_collection” collection home page:

Fusion collection home

The collection home page contains controls for both search and indexing. As this collection doesn’t yet contain any documents, the search results panel is empty.

Indexing: Datasources and Pipelines

Bootstrapping a search app requires an initial indexing run over your data, followed by successive cycles of search and indexing until you have a search app that does what you want it to do and what search users expect it to do. The collections home page indexing toolset contains controls for defining and using datasources and pipelines.

Once you have created a collection, clicking on the “Datasource” control changes the left hand side control panel over to the datasource configuration panel. The first step in configuring a datasource is specifying the kind of data repository to connect to. Fusion connectors are a set of programs which do the work of connecting to and retrieving data from specific repository types. For example, to index a set of web pages, a datasource uses a web connector.

To configure the datasource, choose the “edit” control. The datasource configuration panel controls the choice of indexing pipeline. All datasources are pre-configured with a default indexing pipeline. The “Documents_Parsing” indexing pipeline is the default pipeline for use with a web connector. Beneath the pipeline configuration control is a control “Open <pipeline name> pipeline”. Clicking on this opens a pipeline editing panel next to the datasource configuration panel:

indexing controls

Once the datasource is configured, the indexing job is run by controls on the datasource panel:

datasource controls

The “Start” button, circled in yellow, when clicked, changes to “Stop” and “Abort” controls. Beneath this button is a “Show details”/”Hide details” control, shown in its open state.

Creating and maintaining a complete, up-to-date index over your data is necessary for good search. Much of this process consists of data munging. Connectors and pipelines make this chore manageable, repeatable, and testable. It can be automated using Fusion’s job scheduling and alerting mechanisms.

Search and Relevancy

Once a datasource has been configured and the indexing job is complete, the collection can be searched using the search results tool. A wildcard query of “:” will match all documents in the collection. The following screenshot shows the result of running this query via the search box at the top of the search results panel:

wildcard search

After running the datasource exactly once, the collection consists of 76 posts from the Lucidworks blog, as indicated by the “Last Job” report on the datasource panel, circled in yellow. This agrees with the “num found”, also circled in yellow, at the top of the search results page.

The search query “Fusion” returns the most relevant blog posts about Fusion:

search term Fusion

There are 18 blog posts altogether which have the word “Fusion” either in the title or body of the post. In this screenshot we see the 10 most relevant posts, ranked in descending order.

A search application takes a user search query and returns search results which the user deems relevant. A well-tuned search application is one where the both the user and the system agree on both the set of relevant documents returned for a query and the order in which they are ranked. Fusion’s query pipelines allow you to tune your search and the search results tool lets you test your changes.

Conclusion

Because this post is a brief and gentle introduction to Fusion, I omitted a few details and skipped over a few steps. Nonetheless, I hope that this introduction to the basics of Fusion has made you curious enough to try it for yourself.

The post Search Basics for Data Engineers appeared first on Lucidworks.

Preliminary Data Analysis with Fusion 2: Look, Leap, Repeat

$
0
0

Lucidworks Fusion is the platform for search and data engineering. In article Search Basics for Data Engineers, I introduced the core features of Lucidworks Fusion 2 and used it to index some blog posts from the Lucidworks blog, resulting in a searchable collection. Here is the result of a search for blog posts about Fusion:

search term Fusion

Bootstrapping a search app requires an initial indexing run over your data, followed by successive cycles of search and indexing until your application does what you want it to do and what search users expect it to do. The above search results required one iteration of this process. In this article, I walk through the indexing and query configurations used to produce this result.

Look

Indexing web data is challenging because what you see is not always what you get. That is, when you look at a web page in a browser, the layout and formatting is guiding your eye, making important information more prominent. Here is what a recent Lucidworks blog entry looks like in my browser:

Lucidworks blog page

There are navigational elements at the top of the page, but the most prominent element is the blog post title, followed by the elements below it: date, author, opening sentence, and the first visible section heading below that.

I want my search app to be able to distinguish which information comes from which element, and be able to tune my search accordingly. I could do some by-hand analysis of one or more blog posts, or I could use Fusion to index a whole bunch of them; I choose the latter option.

Leap

Pre-configured Default Pipelines

For the first iteration, I use the Fusion defaults for search and indexing. I create a collection "lw_blogs" and configure a datasource "lw_blogs_ds_default". Website access requires use of the Anda-web datasource, and this datasource is pre-configured to use the "Documents_Parsing" index pipeline.

datasource configuration

I start the job, let it run for a few minutes, and then stop the web crawl. The search panel is pre-populated with a wildcard search using the default query pipeline. Running this search returns the following result:

wildcard search results

At first glance, it looks like all the documents in the index contain the same text, despite having different titles. Closer inspection of the content of individual documents shows that this is not what’s going on. I use the "show all fields" control on the search results panel and examine the contents of field "content":

search result content field

Reading further into this field shows that the content does indeed correspond to the blog post title, and that all text in the body of the HTML page is there. The Apache Tika parser stage extracted the text from all elements in the body of the HTML page and added it to the "content" field of the document, including all whitespace between and around nested elements, in the order in which they occur in the page. Because all the blog posts contain a banner announcement at the top and a set of common navigation elements, all of them have the same opening text:

\n\n \n \n \tSecure Solr with Fusion: Join us for a webinar to learn about the security and access control system that Lucidworks Fusion brings to Solr.\n \n\tRead More \n\n\n \n\n\n \n \n\n \n \n \n \n \t\n\tFusion\n ...

This first iteration shows me what’s going on with the data, however it fails to meet the requirement of being able to distinguish which information comes from which element, resulting in poor search results.

Repeat

Custom Index Pipeline

Iteration one used the "Documents_Parsing" pipeline, which consists of the following stages:

  • Apache Tika Parser – recognizes and parses most common document formats, including HTML
  • Field Mapper – transforms field names to valid Solr field names, as needed
  • Language Detection – transforms text field names based on language of field contents
  • Solr Indexer – transforms Fusion index pipeline document into Solr document and adds (or updates) document to collection.

In order to capture the text from a particular HTML element, I need to add an HTML transform stage to my pipeline. I still need to have an Apache Tika parser stage as the first stage in my pipeline in order to transform the raw bytes sent across the wire by the web crawler via HTTP into an HTML document. But instead of using the Tika HTML parser to extract all text from the HTML body into a single field, I use the HTML transform stage to harvest elements of interest each into its own field. As a first cut at the data, I’ll use just two fields: one for the blog title and the other for the blog text.

I create a second collection "lw_blogs2", and configure another web datasource, "lw_blogs2_ds". When Fusion creates a collection, it also creates an indexing and query pipeline, using the naming convention collection name plus "-default" for both pipelines. I choose the index pipeline "lw_blogs2-default", and open the pipeline editor panel in order to customize this pipeline to process the Lucidworks blog posts:

The initial collection-specific pipeline is configured as a "Default_Data" pipeline: it consists of a Field Mapper stage followed by a Solr Indexer stage.

data default pipeline

Adding new stages to an index pipeline pushes them onto the pipeline stages stack, therefore first I add and HTML Transform stage then I add an Apache Tika parser stage, resulting in a pipeline which starts with an Apache Tika Parser stage followed by an HTML Transform stage. First I edit the Apache Tika Parser stage as follows:

tika parser configuration

When using an Apache Tika parser stage in conjunction with an HTML or XML Transform stage the Tika stage must be configured:

  • option "Add original document content (raw bytes)" setting: false
  • option "Return parsed content as XML or HTML" setting: true
  • option "Return original XML and HTML instead of Tika XML output" setting: true

With these settings, Tika transforms the raw bytes retrieved by the web crawler into an HTML document. The next stage is an HTML Transform stage which extracts the elmenets of interest from the body of the HTML document:

html transform configuration

An HTML transform stage requires the following configuration:

  • property "Record Selector", which specifies the HTML element that contains the document.
  • HTML Mappings, a set of rules which specify how different HTML elements are mapped to Solr document fields.

Here the "Record Selector" property "body" is the same as the default "Body Field Name" because each blog post contains is a single Solr document. Inspection of the raw HTML shows that the blog post title is in an "h1" element, therefore the mapping rule shown above specifies that the text contents of tag "h1" is mapped to the document field named "blog_title_txt". The post itself is inside a tag "article", so the second mapping rule, not shown, specifies:

  • Select Rule: article
  • Attribute: text
  • Field: blog_post_txt

The web crawl also pulled back many pages which contain summaries of ten blog posts but which don’t actually contain a blog post. These are not interesting, therefore I’d like to restrict indexing to only documents which contain a blog post. To do this, I add a condition to the Solr Indexer stage:

Solr indexer configuration

I start the job, let it run for a few minutes, and then stop the web crawl. I run a wildcard search, and it all just works!

wildcard search results

Custom Query Pipeline

To test search, I do a query on the words "Fusion Spark". My first search returns no results. I know this is wrong because the articles pulled back by the wildcard search above mention both Fusion and Spark.

The reason for this apparent failure is that search is over document fields. The blog title and blog post content are now stored in document fields named "blog_title_txt" and "blog_post_txt". Therefore, I need to configure the "Search Fields" stage of the query pipeline to specify that these are search fields.

The left-hand collection home page control panel contains controls for both search and indexing. I click on the "Query Pipelines" control under the "Search" heading, and choose to edit the pipeline named "lw_blogs2-default". This is the query pipeline that was created automatically when the collection "lw_blogs2" was created. I edit the "Search Fields" stage and specify search over both fields. I also set a boost factor of 1.3 on the field "blog_title_txt", so that documents where there’s a match on the title are considered more relevant that documents where there’s a match in the blog post. As soon as I save this configuration, the search is re-run automatically:

wildcard search results

The results look good!

Conclusion

As a data engineer, your mission, should you accept it, is to figure out how to build a search application which bridges the gap between the information in the raw search query and what you know about your data in order to to serve up the document(s) which should be at the top of the results list. Fusion’s default search and indexing pipelines are a quick and easy way to get the information you need about your data. Custom pipelines make this mission possible.

The post Preliminary Data Analysis with Fusion 2: Look, Leap, Repeat appeared first on Lucidworks.

Solr 5’s new ‘bin/post’ utility

$
0
0

Series Introduction

This is the first in a three part series demonstrating the ease and succinctness possible with Solr out of the box.  The three parts to this are:

  • Getting data into Solr using bin/post
  • Visualizing search results: /browse and beyond
  • Putting it together realistically: example/files – a concrete useful domain-specific example of bin/post and /browse

Introducing bin/post: a built-in Solr 5 data indexing tool

In the beginning was the command-line… As part of the ease of use improvements in Solr 5, the bin/post tool was created to allow you to more easily index data and documents. This article illustrates and explains how to use this tool.
For those (pre-5.0) Solr veterans who have most likely run Solr’s “example”, you’ll be familiar with post.jar, under example/exampledocs.  You may have only used it when firing up Solr for the first time, indexing example tech products or book data. Even if you haven’t been using post.jar, give this new interface a try if even for the occasional sending of administrative commands to your Solr instances.  See below for some interesting simple tricks that can be done using this tool.
Let’s get started by firing up Solr and creating a collection:
$ bin/solr start
$ bin/solr create -c solr_docs
The bin/post tool can index a directory tree of files, and the Solr distribution has a handy docs/ directory to demonstrate this capability:
$ bin/post -c solr_docs docs/

java -classpath /Users/erikhatcher/solr-5.3.0/dist/solr-core-5.3.0.jar -Dauto=yes -Dc=solr_docs -Ddata=files -Drecursive=yes org.apache.solr.util.SimplePostTool /Users/erikhatcher/solr-5.3.0/docs/
SimplePostTool version 5.0.0
Posting files to [base] url http://localhost:8983/solr/solr_docs/update...
Entering auto mode. File endings considered are xml,json,csv,pdf,doc,docx,ppt,pptx,xls,xlsx,odt,odp,ods,ott,otp,ots,rtf,htm,html,txt,log
Entering recursive mode, max depth=999, delay=0s
Indexing directory /Users/erikhatcher/solr-5.3.0/docs (3 files, depth=0)
.
.
.
3575 files indexed.
COMMITting Solr index changes to http://localhost:8983/solr/solr_docs/update...
Time spent: 0:00:30.705
30 seconds later we have Solr’s docs/ directory indexed and available for searching. Foreshadowing to the next post in this series, check out http://localhost:8983/solr/solr_docs/browse?q=faceting to see what you’ve got. Is there anything bin/post can do that clever curling can’t do?  Not a thing, though you’d have to iterate over a directory tree of files or do web crawling and parsing out links to follow for entirely comparable capabilities.  bin/post is meant to simplify the (command-line) interface for many common Solr ingestion and command needs.

Usage

The tool provides solid -h help, with the abbreviated usage specification being:
$ bin/post -h
Usage: post -c <collection> [OPTIONS] <files|directories|urls|-d ["...",...]>
    or post -help

   collection name defaults to DEFAULT_SOLR_COLLECTION if not specified
...
See the full bin/post -h output for more details on parameters and example usages. A collection, or URL, must always be specified with -c (or by DEFAULT_SOLR_COLLECTION set in the environment) or -url. There are parameters to control the base Solr URL using -host, -port, or the full -url. Note that when using -url it must be the full URL, including the core name all the way through to the /update handler, such as -url http://staging_server:8888/solr/core_name/update.

Indexing “rich documents” from the file system or web crawl

File system indexing was demonstrated above, indexing Solr’s docs/ directory which includes a lot of HTML files. Another fun example of this is to index your own documents folder like this:
bin/solr create -c my_docs
bin/post -c my_docs ~/Documents
There’s a constrained list of file types (by file extension) that bin/post will pass on to Solr, skipping the others.  bin/post -h provides the default list used. To index a .png file, for example, set the -filetypes parameter: bin/post -c test -filetypes png image.png.  To not skip any files, use “*” for the filetypes setting: bin/post -c test -filetypes "*" docs/ (note the double-quotes around the asterisk, otherwise your shell may expand that to a list of files and not operate as intended) Browse and search your own documents at http://localhost:8983/solr/my_docs/browse

Rudimentary web crawl

Careful now: crawling web sites is no trivial task to do well. The web crawling available from bin/post is very basic, single-threaded, and not intended for serious business.  But it sure is fun to be able to fairly quickly index a basic web site and get a feel for the types of content processing and querying issues to face as a production scale crawler or other content acquisition means are in the works:
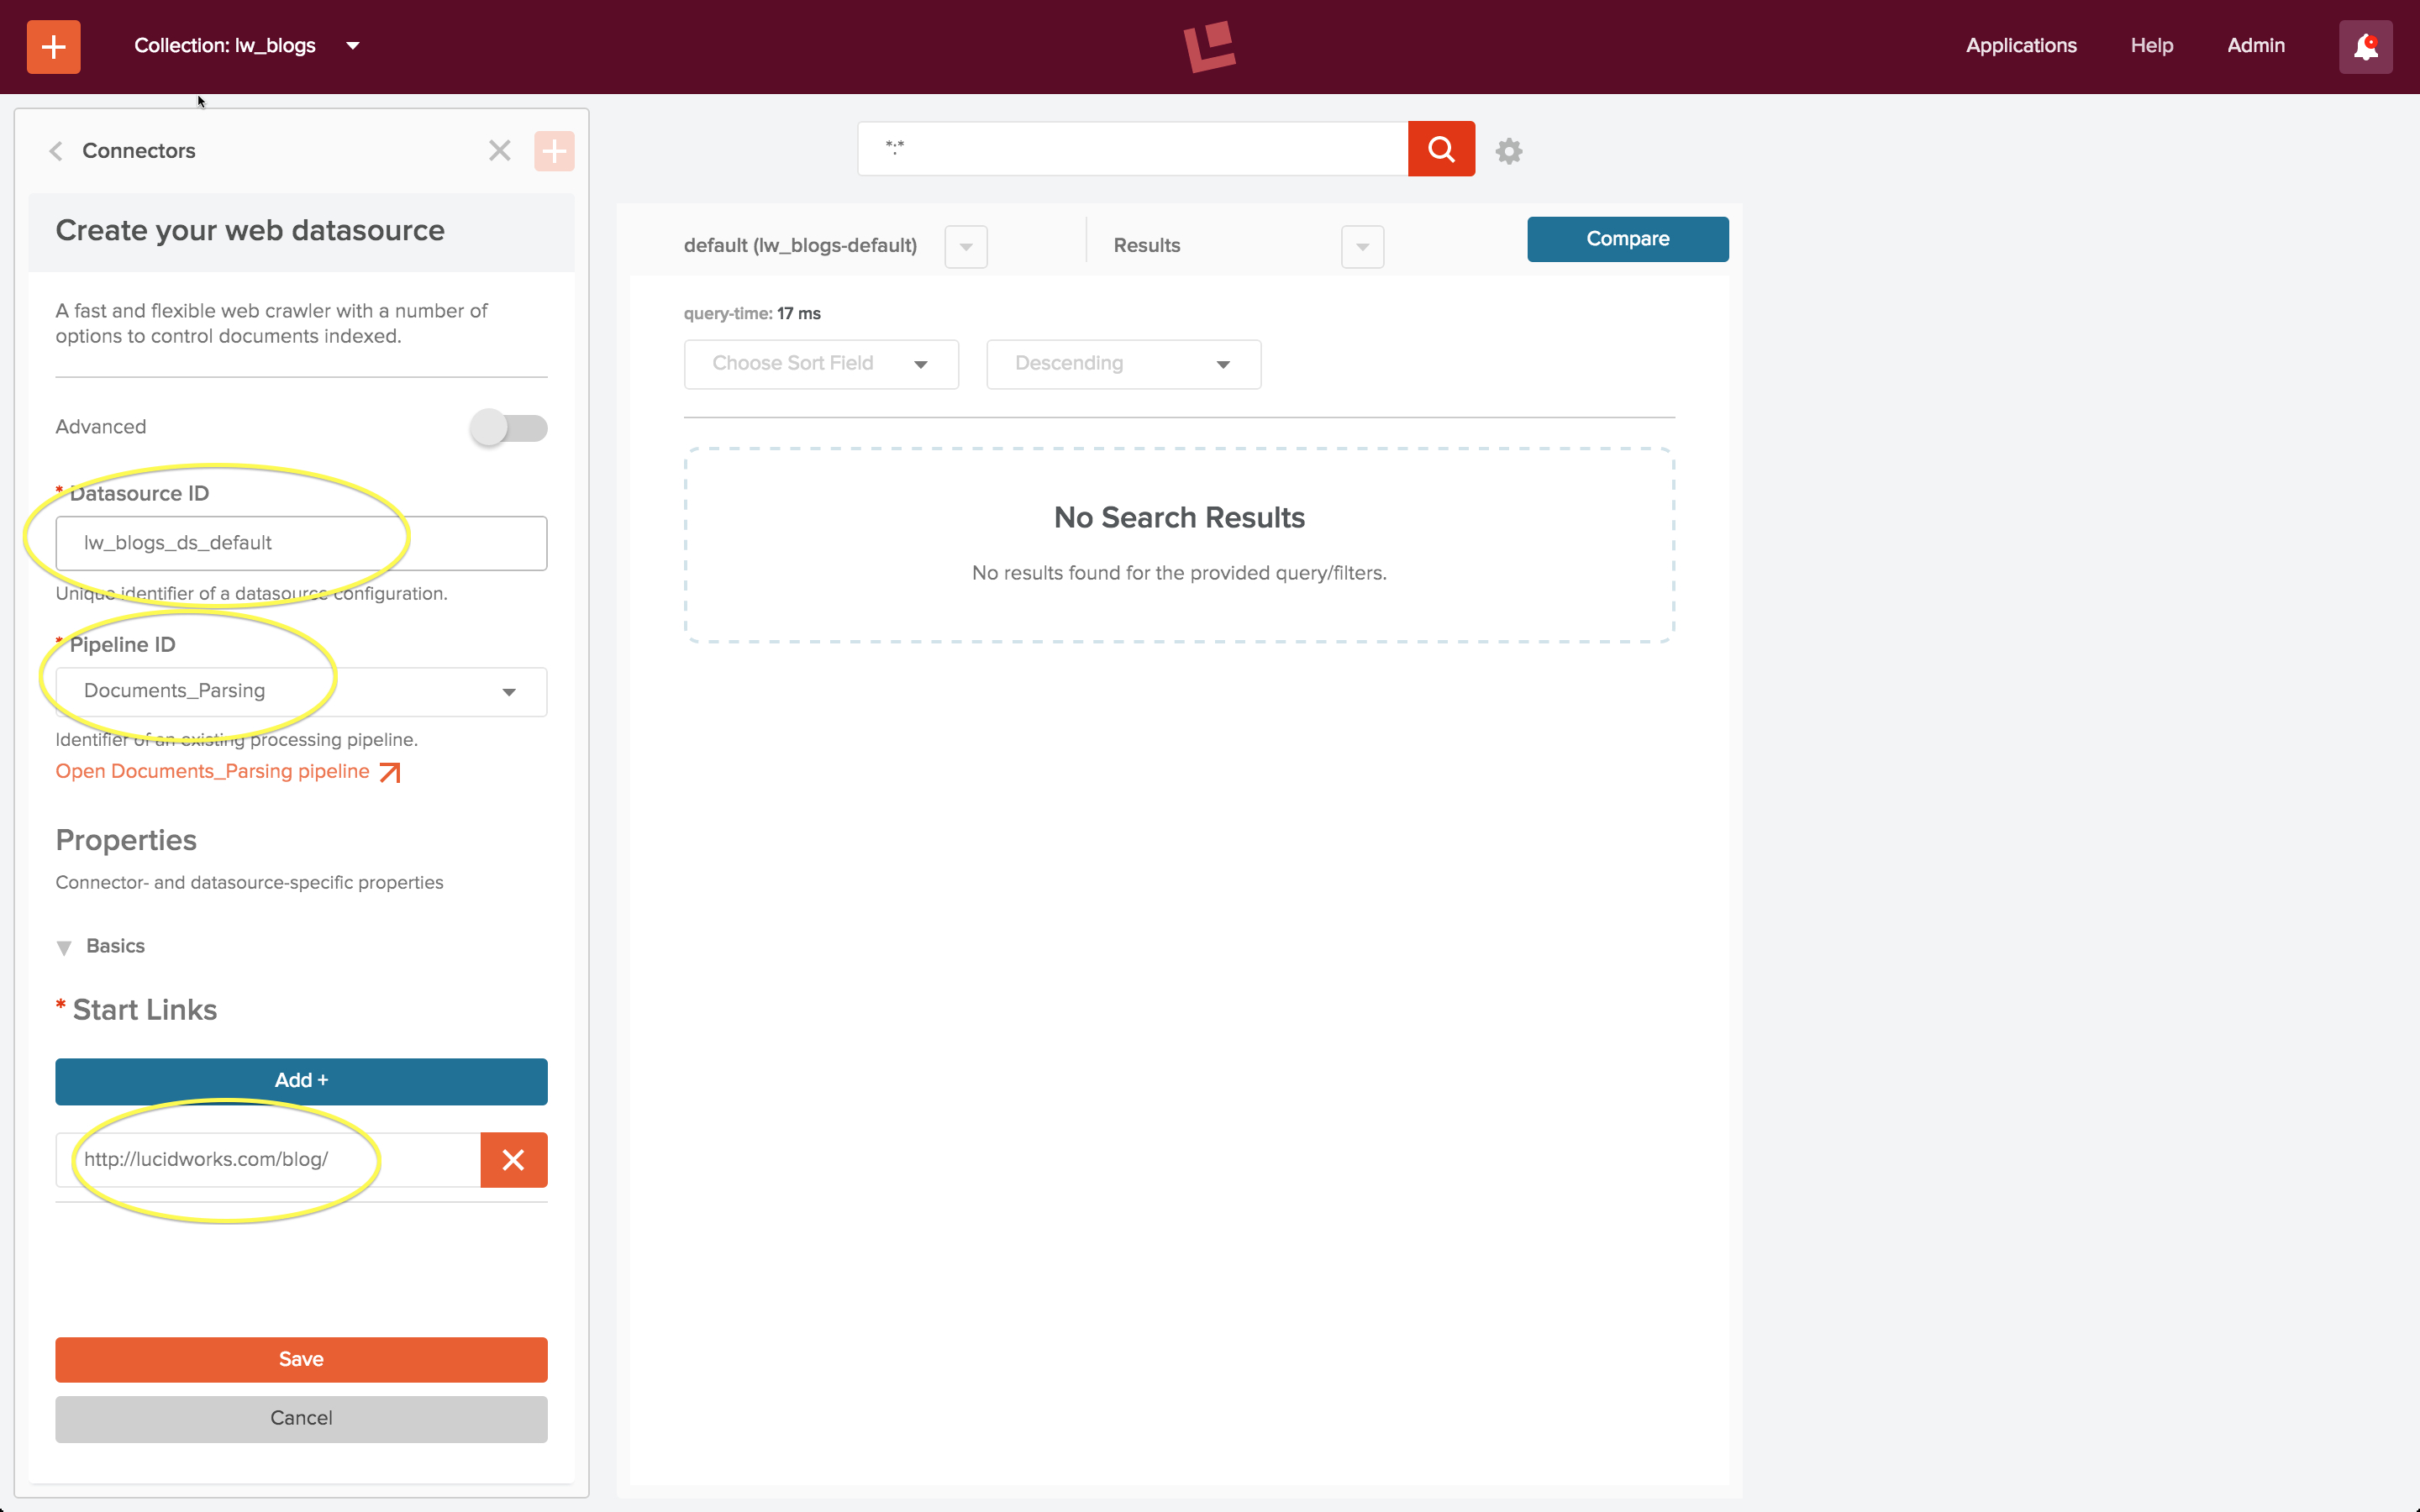
$ bin/solr create -c site
$ bin/post -c site http://lucidworks.com -recursive 2 -delay 1  # (this will take some minutes)
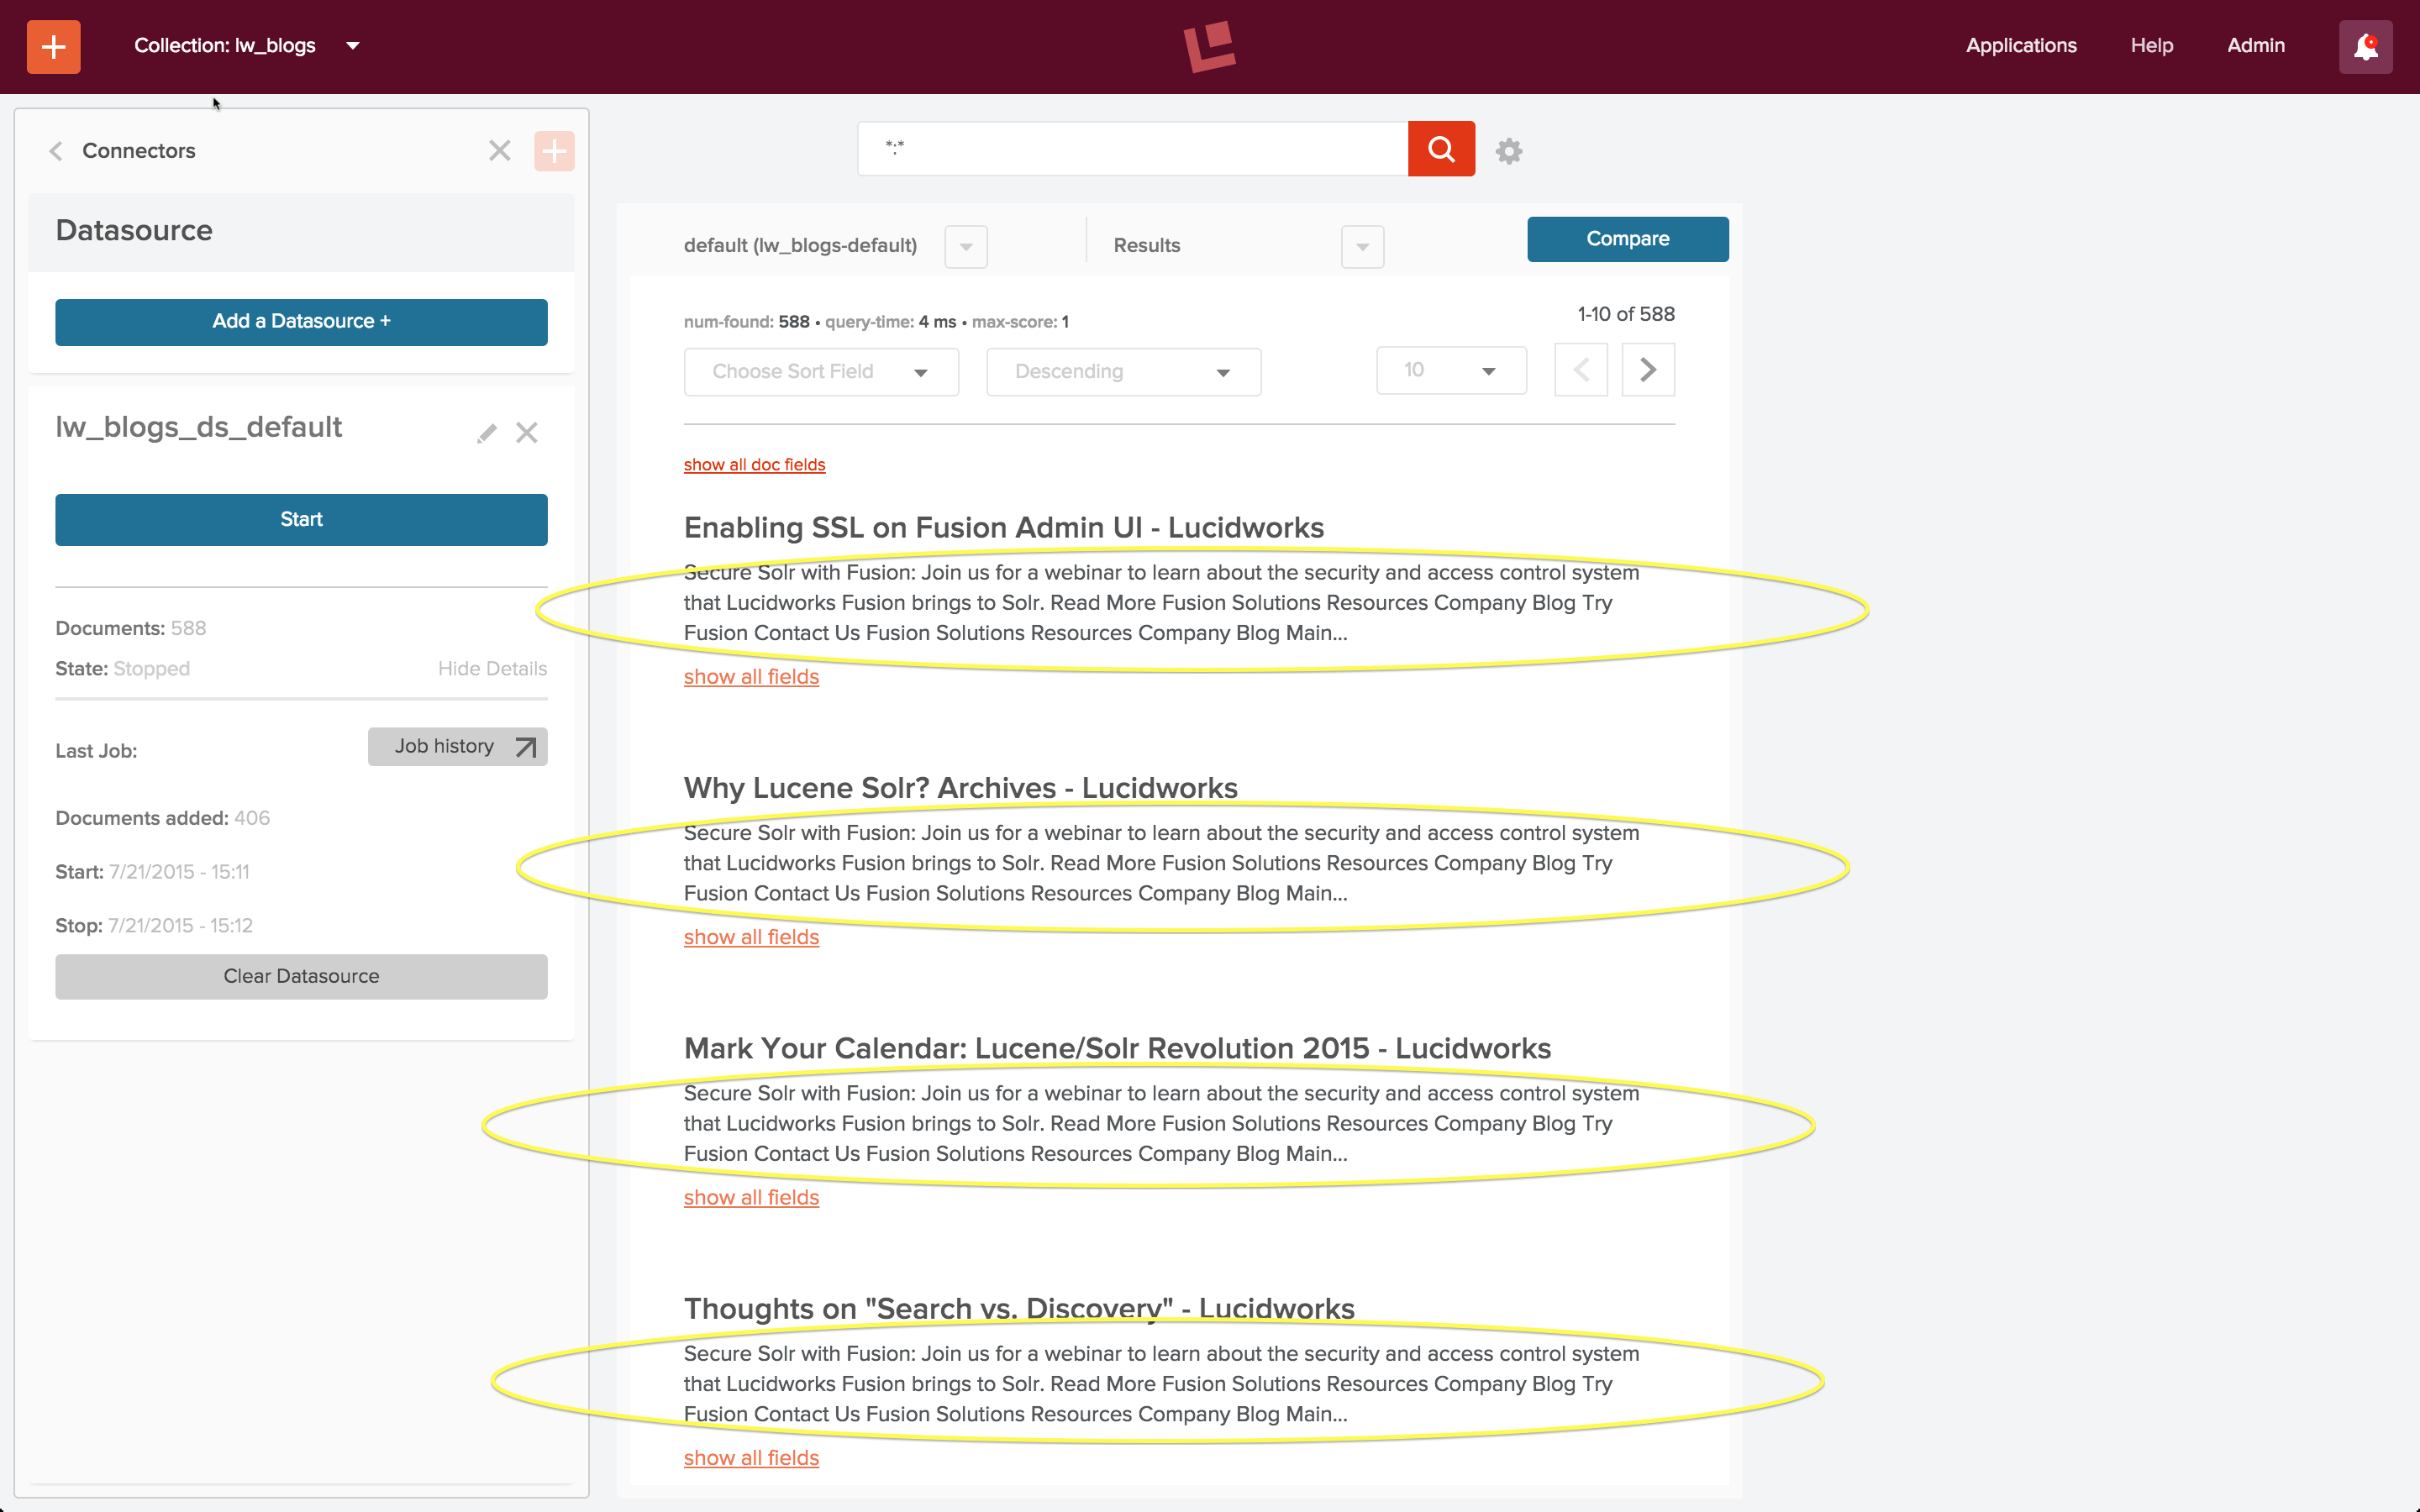
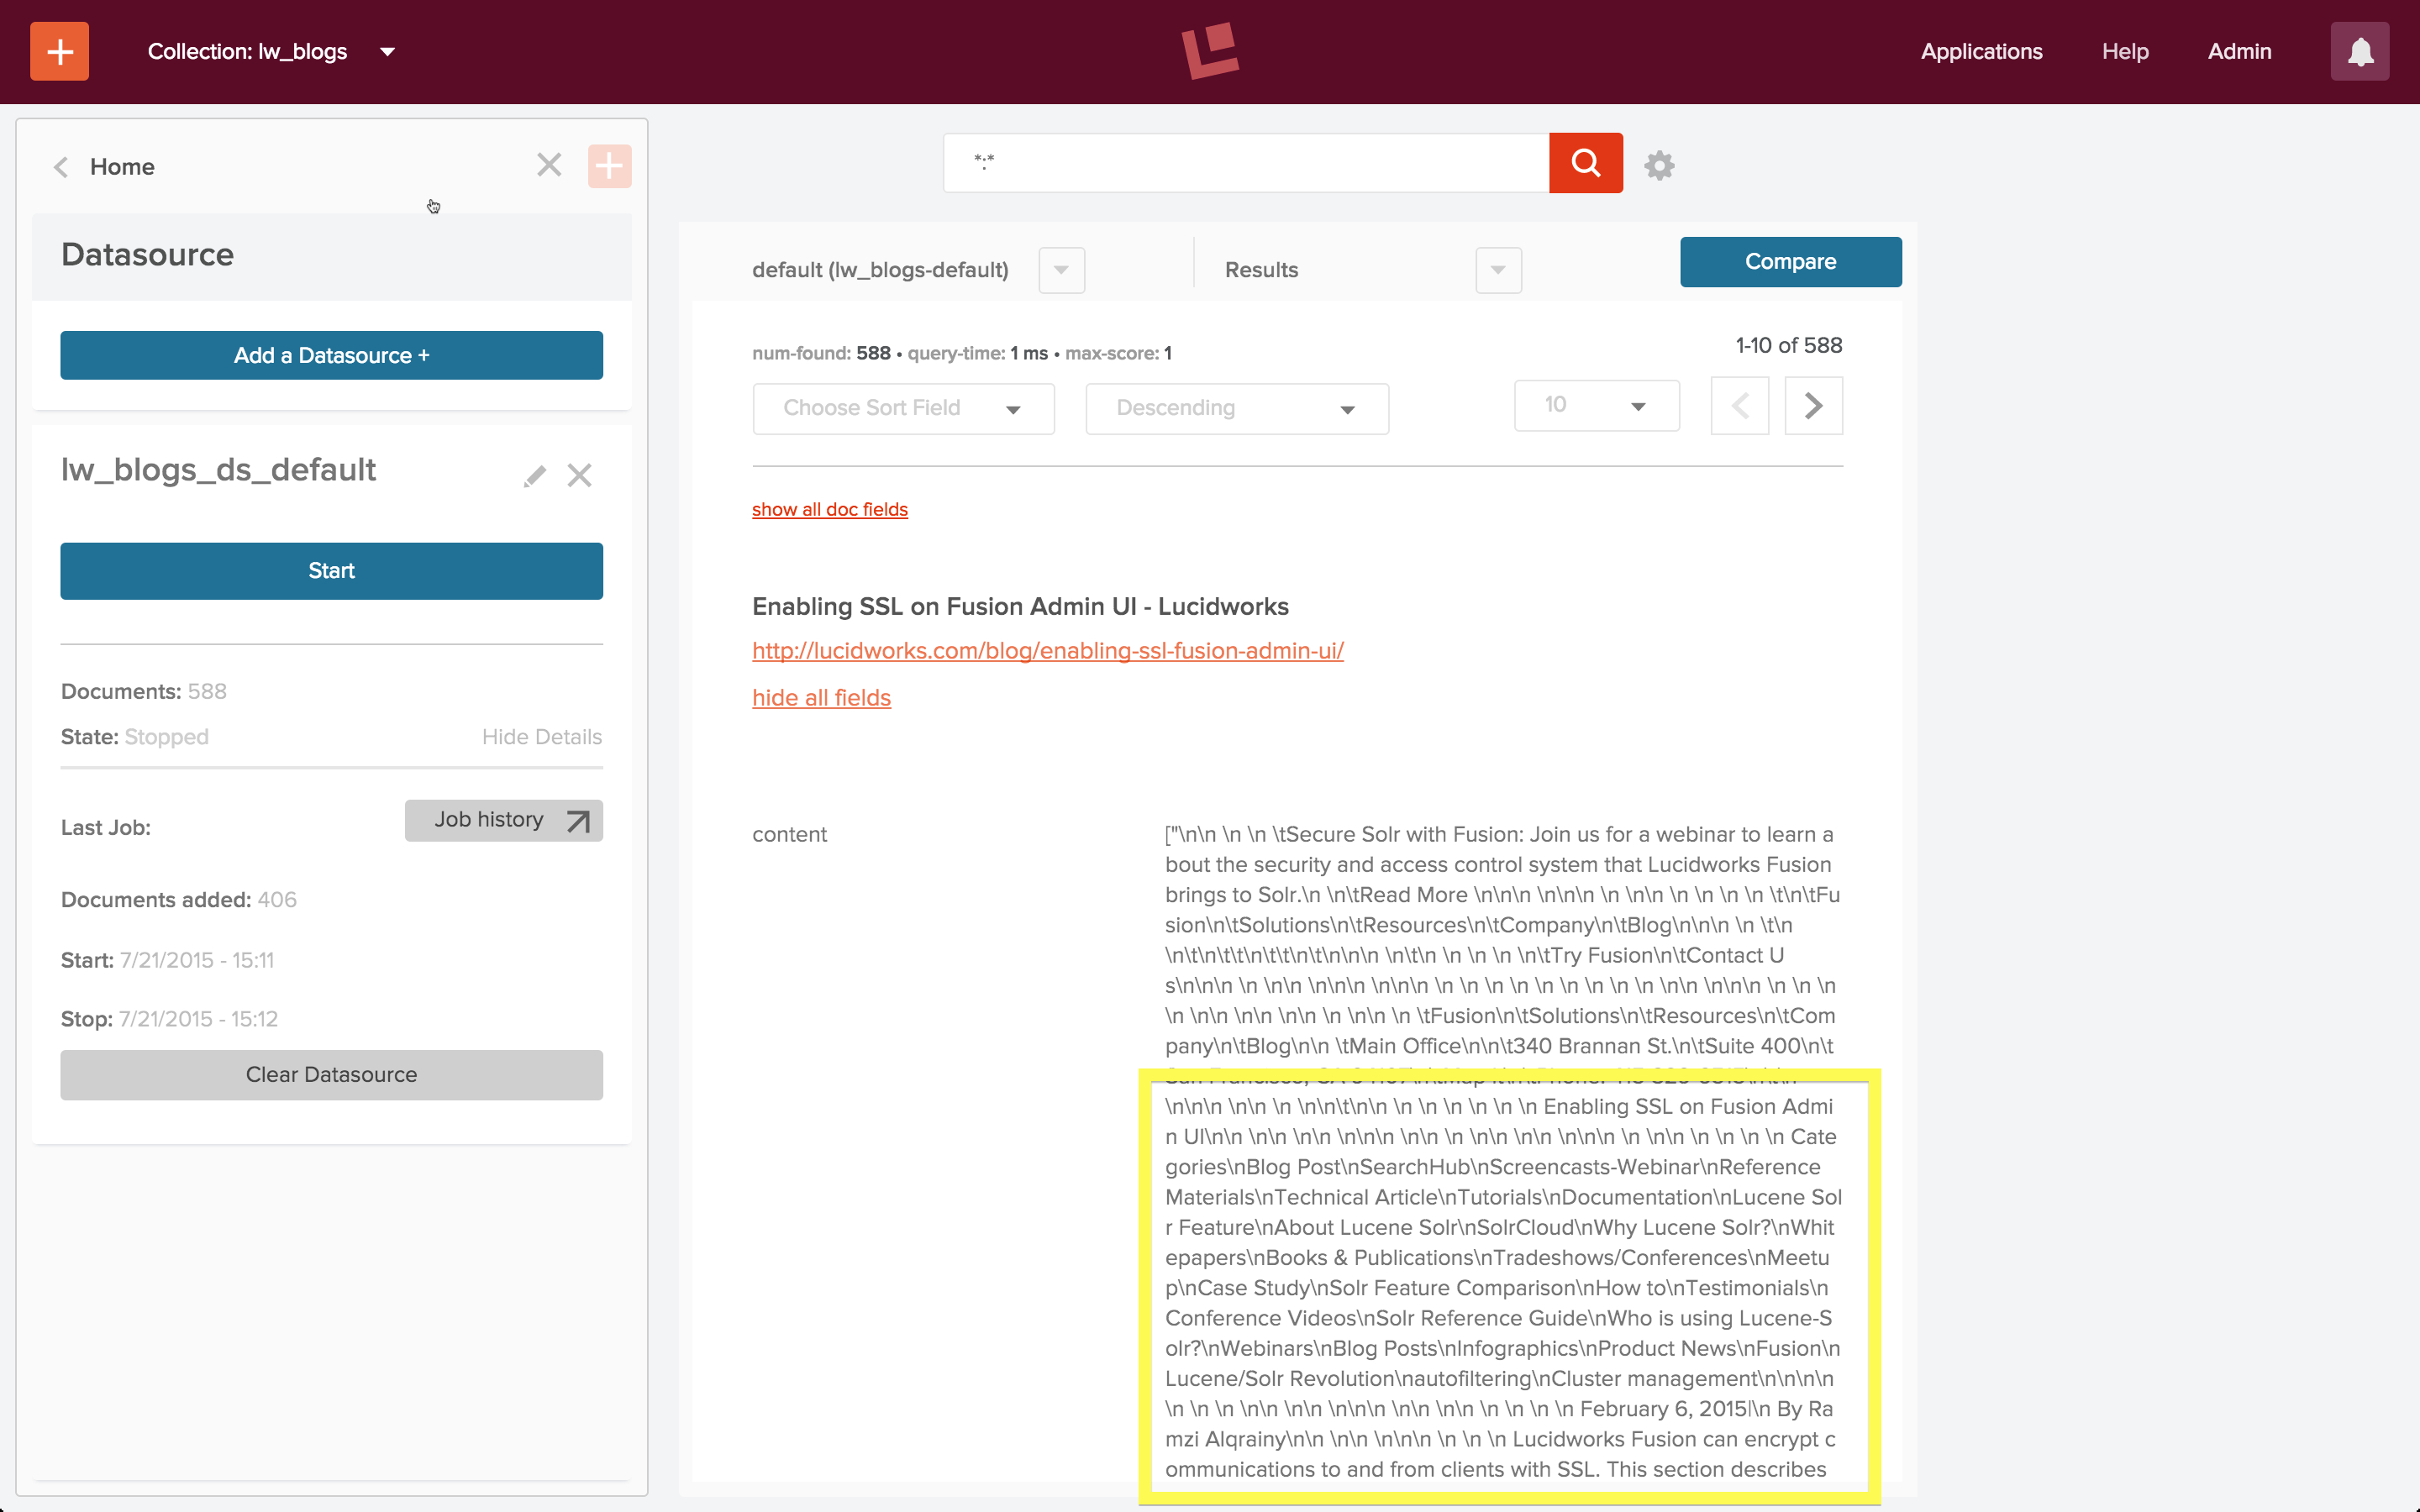
Web crawling adheres to the same content/file type filtering as the file crawling mentioned above; use -filetypes as needed.  Again, check out /browse; for this example try http://localhost:8983/solr/site/browse?q=revolution

Indexing CSV (column/delimited) files

Indexing CSV files couldn’t be easier! It’s just this, where data.csv is a standard CSV file:
$ bin/post -c collection_name data.csv
CSV files are handed off to the /update handler with the content type of “text/csv”. It detects it is a CSV file by the .csv file extension. Because the file extension is used to pick the content type and it currently only has a fixed “.csv” mapping to text/csv, you will need to explicitly set the content -type like this if the file has a different extension:
$ bin/post -c collection_name -type text/csv data.file
If the delimited file does not have a first line of column names, some columns need excluding or name mapping, the file is tab rather than comma delimited, or you need to specify any of the various options to the CSV handler, the -params option can be used. For example, to index a tab-delimited file, set the separator parameter like this:
$ bin/post -c collection_name data.tsv -type text/csv -params "separator=%09"
The key=value pairs specified in -params must be URL encoded and ampersand separated (tab is url encoded as %09).  If the first line of a CSV file is data rather than column names, or you need to override the column names, you can provide the fieldnames parameter, setting header=true if the first line should be ignored:
$ bin/post -c collection_name data.csv -params "fieldnames=id,foo&header=true"
Here’s a neat trick you can do with CSV data, add a “data source”, or some type of field to identify which file or data set each document came from. Add a literal.<field_name>= parameter like this:
$ bin/post -c collection_name data.csv -params "literal.data_source=temp"
Provided your schema allows for a data_source field to appear on documents, each file or set of files you load get tagged to some scheme of your choosing making it easy to filter, delete, and operate on that data subset.  Another literal field name could be the filename itself, just be sure that the file being loaded matches the value of the field (easy to up-arrow and change one part of the command-line but not another that should be kept in sync).

Indexing JSON

If your data is in Solr JSON format, it’s just bin/post -c collection_name data.json. Arbitrary, non-Solr, JSON can be mapped as well. Using the exam grade data and example from here, the splitting and mapping parameters can be specified like this:
$ bin/post -c collection_name grades.json -params "split=/exams&f=first:/first&f=last:/last&f=grade:/grade&f=subject:/exams/subject&f=test:/exams/test&f=marks:/exams/marks&json.command=false"
Note that json.command=false had to be specified so the JSON is interpreted as data not as potential Solr commands.

Indexing Solr XML

Good ol’ Solr XML, easy peasy: bin/post -c collection_name data.xml. Alas, there’s currently no splitting and mapping capabilities for arbitrary XML using bin/post; use Data Import Handler with the XPathEntityProcessor to accomplish this for now. See SOLR-6559 for more information on this future enhancement.

Sending commands to Solr

Besides indexing documents, bin/post can also be used to issue commands to Solr. Here are some examples:
  • Commit: bin/post -c collection_name -out yes -type application/json -d '{commit:{}}' Note: For a simple commit, no data/command string is actually needed.  An empty, trailing -d suffices to force a commit, like this – bin/post -c collection_name -d
  • Delete a document by id: bin/post -c collection_name -type application/json -out yes -d '{delete: {id: 1}}'
  • Delete documents by query: bin/post -c test -type application/json -out yes -d '{delete: {query: "data_source:temp"}}'
The -out yes echoes the HTTP response body from the Solr request, which generally isn’t any more helpful with indexing errors, but is nice to see with commands like commit and delete, even on success. Commands, or even documents, can be piped through bin/post when -d dangles at the end of the command-line:
# Pipe a commit command
$ echo '{commit: {}}' | bin/post -c collection_name -type application/json -out yes -d

# Pipe and index a CSV file
$ cat data.csv | bin/post -c collection_name -type text/csv -d

Inner workings of bin/post

The bin/post tool is a straightforward Unix shell script that processes and validates command-line arguments and launches a Java program to do the work of posting the file(s) to the appropriate update handler end-point. Currently, SimplePostTool is the Java class used to do the work (the core of the infamous post.jar of yore). Actually post.jar still exists and is used under bin/post, but this is an implementation detail that bin/post is meant to hide. SimplePostTool (not the bin/post wrapper script) uses the file extensions to determine the Solr end-point to use for each POST.  There are three special types of files that POST to Solr’s /update end-point: .json, .csv, and .xml. All other file extensions will get posted to the URL+/extract end-point, richly parsing a wide variety of file types. If you’re indexing CSV, XML, or JSON data and the file extension doesn’t match or isn’t actually a file (if you’re using the -d option) be sure to explicitly set the -type to text/csv, application/xml, or application/json.

Stupid bin/post tricks

Introspect rich document parsing and extraction

Want to see how Solr’s rich document parsing sees your files? Not a new feature, but a neat one that can be exploited through bin/post by sending a document to the extract handler in a debug mode returning an XHTML view of the document, metadata and all. Here’s an example, setting -params with some extra settings explained below:
$ bin/post -c test -params "extractOnly=true&wt=ruby&indent=yes" -out yes docs/SYSTEM_REQUIREMENTS.html
java -classpath /Users/erikhatcher/solr-5.3.0/dist/solr-core-5.3.0.jar -Dauto=yes -Dparams=extractOnly=true&wt=ruby&indent=yes -Dout=yes -Dc=test -Ddata=files org.apache.solr.util.SimplePostTool /Users/erikhatcher/solr-5.3.0/docs/SYSTEM_REQUIREMENTS.html
SimplePostTool version 5.0.0
Posting files to [base] url http://localhost:8983/solr/test/update?extractOnly=true&wt=ruby&indent=yes...
Entering auto mode. File endings considered are xml,json,csv,pdf,doc,docx,ppt,pptx,xls,xlsx,odt,odp,ods,ott,otp,ots,rtf,htm,html,txt,log
POSTing file SYSTEM_REQUIREMENTS.html (text/html) to [base]/extract
{
  'responseHeader'=>{
    'status'=>0,
    'QTime'=>3},
  ''=>'<?xml version="1.0" encoding="UTF-8"?>
<html xmlns="http://www.w3.org/1999/xhtml">
<head>
<meta
name="stream_size" content="1100"/>
<meta name="X-Parsed-By"
            content="org.apache.tika.parser.DefaultParser"/>
<meta
name="X-Parsed-By"
            content="org.apache.tika.parser.html.HtmlParser"/>
<meta
name="stream_content_type" content="text/html"/>
<meta name="dc:title"
            content="System Requirements"/>
<meta
name="Content-Encoding" content="UTF-8"/>
<meta name="resourceName"
            content="/Users/erikhatcher/solr-5.2.0/docs/SYSTEM_REQUIREMENTS.html"/>
<meta
name="Content-Type"
                content="text/html; charset=UTF-8"/>
<title>System Requirements</title>
</head>
<body>
<h1>System Requirements</h1>
   ...
</body>
</html>
',
  'null_metadata'=>[
    'stream_size',['1100'],
    'X-Parsed-By',['org.apache.tika.parser.DefaultParser',
      'org.apache.tika.parser.html.HtmlParser'],
    'stream_content_type',['text/html'],
    'dc:title',['System Requirements'],
    'Content-Encoding',['UTF-8'],
    'resourceName',['/Users/erikhatcher/solr-5.3.0/docs/SYSTEM_REQUIREMENTS.html'],
    'title',['System Requirements'],
    'Content-Type',['text/html; charset=UTF-8']]}
1 files indexed.
COMMITting Solr index changes to http://localhost:8983/solr/test/update?extractOnly=true&wt=ruby&indent=yes...
Time spent: 0:00:00.027
Setting extractOnly=true instructs the extract handler to return the structured parsed information rather than actually index the document. Setting wt=ruby (ah yes! go ahead, try it in json or xml :) and indent=yes allows the output (be sure to specify -out yes!) to render readably in a console.

Prototyping, troubleshooting, tinkering, demonstrating

It’s really handy to be able to test and demonstrate a feature of Solr by “doing the simplest possible thing that will work”  and bin/post makes this a real joy.  Here are some examples –

Does it match?

This technique allows you to easily index data and quickly see how queries work against it.  Create a “playground” index and post a single document with fields id, description, and value:
$ bin/solr create -c playground
$ bin/post -c playground -type text/csv -out yes -d $'id,description,value\n1,are we there yet?,0.42'

Unix Note: that dollar-sign before the single-quoted CSV string is crucial for the new-line escaping to pass through properly.  Or one could post the same data but putting the field names into a separate parameter using bin/post -c playground -type text/csv -out yes -params "fieldnames=id,description,value" -d '1,are we there yet?,0.42' avoiding the need for a new-line and the associated issue.

Does it match a fuzzy query?  their~, in the /select request below, is literally a FuzzyQuery, and ends up matching the document indexed (based on string edit distance fuzziness), rows=0 so we just see the numFound and debug=query output:

$ curl 'http://localhost:8983/solr/playground/select?q=their~&wt=ruby&indent=on&rows=0&debug=query'
{
  'responseHeader'=>{
    'status'=>0,
    'QTime'=>0,
    'params'=>{
      'q'=>'their~',
      'debug'=>'query',
      'indent'=>'on',
      'rows'=>'0',
      'wt'=>'ruby'}},
  'response'=>{'numFound'=>1,'start'=>0,'docs'=>[]
  },
  'debug'=>{
    'rawquerystring'=>'their~',
    'querystring'=>'their~',
    'parsedquery'=>'_text_:their~2',
    'parsedquery_toString'=>'_text_:their~2',
    'QParser'=>'LuceneQParser'}}

Have fun with your own troublesome text, simply using an id field and any/all fields involved in your test queries, and quickly get some insight into how documents are indexed, text analyzed, and queries match.  You can use this CSV trick for testing out a variety of scenarios, including complex faceting, grouping, highlighting, etc often with just a small bit of representative CSV data.

Windows, I’m sorry. But don’t despair.

bin/post is a Unix shell script. There’s no comparable Windows command file, like there is for bin/solr. The developer of bin/post is a grey beard Unix curmudgeon and scoffs “patches welcome” when asked where the Windows version is.  But don’t despair, before there was bin/post there was post.jar. And there still is post.jar.  See the Windows support section of the Reference Guide for details on how to run the equivalent of everything bin/post can do.

Future

What more could you want out of a tool to post content to Solr? Turns out a lot! Here’s a few ideas for improvements:
  • For starters, SolrCloud support is needed. Right now the exact HTTP end-point is needed, whereas SolrCloud indexing is best done with ZooKeeper awareness. Perhaps this fits under SOLR-7268.
  • SOLR-7057: Better content-type detection and handling (.tsv files could be considered delimited with separator=%09 for example)
  • SOLR-6994: Add a comparable Windows command file
  • SOLR-7042: Improve bin/post’s arbitrary JSON handling
  • SOLR-7188: And maybe, just maybe, this tool could also be the front-end to client-side Data Import Handler
And no doubt there are numerous other improvements to streamline the command-line syntax and hardiness of this handy little tool.

Conclusion

$ bin/post -c your_collection your_data/
No, bin/post is not necessarily the “right” way to get data into your system considering streaming Spark jobs, database content, heavy web crawling, or other Solr integrating connectors.  But pragmatically maybe it’s just the ticket for sending commit/delete commands to any of your Solr servers, or doing some quick tests.  And, say, if you’ve got a nightly process that produces new data as CSV files, a cron job to bin/post the new data would be as pragmatic and “production-savvy” as anything else.

Next up…

With bin/post, you’ve gotten your data into Solr in one simple, easy-to-use command.  That’s an important step, though only half of the equation.  We index content in order to be able to query it, analyze it, and visualize it.  The next article in this series delves into Solr’s templated response writing capabilities, providing a typical (and extensible) search results user interface.

The post Solr 5’s new ‘bin/post’ utility appeared first on Lucidworks.

Basics of Storing Signals in Solr with Fusion for Data Engineers

$
0
0

In April we featured a guest post Mixed Signals: Using Lucidworks Fusion’s Signals API, which is a great introduction to the Fusion Signals API. In this post I work through a real-world e-commerce dataset to show how quickly the Fusion platform lets you leverage signals derived from search query logs to rapidly and dramatically improve search results over a products catalog.

Signals, What’re They Good For?

In general, signals are useful any time information about outside activity, such as user behavior, can be used to improve the quality of search results. Signals are particularly useful in e-commerce applications, where they can be used to make recommendations as well as to improve search. Signal data comes from server logs and transaction databases which record items that users search for, view, click on, like, or purchase. For example, clickstream data which records a user’s search query together with the item which was ultimately clicked on is treated as one “click” signal and can be used to:

  • enrich the results set for that search query, i.e., improve the items returned for that query
  • enrich the information about the item clicked on, i.e., improve the queries for that item
  • uncover similarities between items, i.e., cluster items based on other clicks on for queries
  • make recommendations of the form:
    • “other customers who entered this query clicked on that”
    • “customers who bought this also bought that”
  • Signals Key Concepts

    • A signal is a piece of information, event, or action, e.g., user queries, clicks, and other recorded actions that can be related back to a document or documents which are stored in a Fusion collection, referred to as the “primary collection”.
      • A signal has a type, an id, and a timestamp. For example, signals from clickstream information are of type “click” and signals derived from query logs are of type “query”.
      • Signals are stored in an auxiliary collection and naming conventions link the two so that the name of the signals collection is the name the primary collection plus the suffix “_signals”.
    • An aggregation is the result of processing a stream of signals into a set of summaries that can be used to improve the search experience. Aggregation is necessary because in the usual case there is a high volume of signals flowing into the system but each signal contains only a small amount of information in and of itself.
      • Aggregations are stored in an auxiliary collection and naming conventions link the two so that the name of the aggregations collection is the name the primary collection plus the suffix “_signals_aggr”.
      • Query pipelines use aggregated signals to boost search results.
      • Fusion provides an extensive library of aggregation functions allowing for complex models of user behavior. In particular, date-time functions provide a temporal decay function so that over time, older signals are automatically downweighted.
    • Fusion’s job scheduler provides the mechanism for processing signals and aggregations collections in near real-time.

    Some Assembly Required

    In a canonical e-commerce application, your primary Fusion collection is the collection over your products, services, customers, and similar. Event information from transaction databases and server logs would be indexed into an auxiliary collection of raw signal data and subsequently processed into an aggregated signals collection. Information from the aggregated signals collection would be used to improve search over the primary collection and make product recommendations to users.

    In the absence of a fully operational ecommerce website, the Fusion distribution includes an example of signals and a script that processes this signal data into an aggregated signals collection using the Fusion Signals REST-API. The script and data files are in the directory $FUSION/examples/signals (where $FUSION is the top-level directory of the Fusion distribution). This directory contains:

    • signals.json – a sample data set of 20,000 signal events. These are ‘click’ events.
    • signals.sh – a script that loads signals, runs one aggregation job, and gets recommendations from the aggregated signals.
    • aggregations_definition.json – examples of how to write custom aggregation functions. These examples demonstrate several different advanced features of aggregation scripting, all of which are outside of the scope of this introduction.

    The example signals data comes from a synthetic dataset over Best Buy query logs from 2011. Each record contains the user search query, the categories searched, and the item ultimately clicked on. In the next sections I create the product catalog, the raw signals, and the aggregated signals collections.

    Product Data: the primary collection ‘bb_catalog’

    In order to put the use of signals in context, first I recreate a subset of the Best Buy product catalog. Lucidworks cannot distribute the Best Buy product catalog data that is referenced by the example signals data, but that data is available from the Best Buy Developer API, which is a great resource both for data and example apps. I have a copy of previously downloaded product data which has been processed into a single file containing a list of products. Each product is a separate JSON object with many attribute-value pairs. To create your own Best Buy product catalog dataset, you must register as a developer via the above URL. Then you can use the Best Buy Developer API query tool to select product records or you can download a set of JSON files over the complete product archives.

    I create a data collection called “bb_catalog” using the Fusion 2.0 UI. By default, this creates collections for the signals and aggregated signals as well.

    new collection

    Although the collections panel only lists collection “bb_catalog”, collections “bb_catalog_signals” and “bb_catalog_signals_aggr” have been created as well. Note that when I’m viewing collection “bb_catalog”, the URL displayed in the browser is: “localhost:8764/panels/bb_catalog”:

    browser view collection

    By changing the collection name to “bb_catalog_signals” or “bb_catalog_signals_aggr”, I can view the (empty) contents of the auxiliary collections:

    browser view collection

    Next I index the Best Buy product catalog data into collection “bb_catalog”. If you choose to get the data in JSON format, you can ingest it into Fusion using the “JSON” indexing pipeline. See blog post Preliminary Data Analysis in Fusion 2 for more details on configuring and running datasources in Fusion 2.

    After loading the product catalog dataset, I check to see that collection “bb_catalog” contains the products referenced by the signals data. The first entry in the example signals file “signals.json”is a search query with query text: “Televisiones Panasonic 50 pulgadas” and docId: “2125233”. I do a quick search to find a product with this id in collection “bb_catalog”, and the results are as expected:

    bb_catalog search result

    Raw Signal Data: the auxiliary collection ‘bb_catalog_signals’

    The raw signals data in the file “signals.json” are the synthetic Best Buy dataset. I’ve modified the timestamps on the search logs in order to make them seem like fresh log data. This is the first signal (timestamp updated):

      {
        "timestamp": "2015-06-01T23:44:52.533Z",
        "params": {
          "query": "Televisiones Panasonic  50 pulgadas",
          "docId": "2125233",
          "filterQueries": [
            "cat00000",
            "abcat0100000",
            "abcat0101000",
            "abcat0101001"
          ]
        },
        "type": "click"
      },
    

    The top-level attributes of this object are:

    • type – As stated above, all signals must have a “type”, and as noted in the earlier post “Mixed Signals”, section “Sending Signals”, the value should be applied consistently to ensure accurate aggregation. In the example dataset, all signals are of type “click”.
    • timestamp – This data has timestamp information. If not present in the raw signal, it will be generated by the system.
    • id – These signals don’t have distinct ids; they will be generated automatically by the system.
    • params – This attribute contains a set of key-value pairs, using a set of pre-defined keys which a appropriate for search-query event information. In this dataset, the information captured includes the free-text search query entered by the user, the document id of the item clicked on, and the set of Best Buy site categories that the search was restricted to. These are codes for categories and sub-categories such as “Electronics” or “Televisions”.

    In summary, this dataset is an unremarkable snapshot of user behaviors between the middle of August and the end of October, 2011 (updated to May through June 2015).

    The example script “signals.sh” loads the raw signal via a POST request to the Fusion REST-API endpoint: /api/apollo/signals/<collectionName> where <collectionName> is the name of the primary collection itself. Thus, to load raw signal data into the Fusion collection “bb_catalog_signals”, I send a POST request to the endpoint: /api/apollo/signals/bb_catalog

    Like all indexing processes, an indexing pipeline is used to process the raw signal data into a set of Solr documents. The pipeline used here is the default signals indexing pipeline named “_signals_ingest”. This pipeline consists of three stages, the first of which is a Signal Formatter stage, followed by a Field Mapper stage, and finally a Solr Indexer stage.

    (Note that in a production system, instead of doing a one time upload of some server log data, raw signal data could be streamed into a signals collection an ongoing basis by using a Logstash or JDBC connector together with a signals indexing pipeline. For details on using a Logstash connector, see blog post on Fusion with Logstash).

    Here is the curl command I used, running Fusion locally in single server mode on the default port:

    curl -u admin:password123 -X POST -H 'Content-type:application/json' http://localhost:8764/api/apollo/signals/bb_catalog?commit=true  --data-binary @new_signals.json

    This command succeeds silently. To check my work, I use the Fusion 2 UI to view the signals collection, by explicitly specifying the URL “localhost:8764/panels/bb_catalog_signals”. This shows that all 20K signals have been indexed:

    collection bb_catalog_signals

    Further exploration of the data can be done using Fusion dashboards. To configure a Fusion dashboard using Banana 3, I specify the URL “localhost:8764/banana”. (For details and instructions on Banana 3 dashboards, see this this post on log analytics). I configure a signals dashboard and view the results:

    dashboard bb_catalog_signals

    The top row of this dashboard shows that there are 20,000 clicks in the collection bb_catalog_signals that were recorded in the last 90 days. The middle row contains a bar-chart showing the time at which the clicks came in and a pie chart display of top 200 documents that were clicked on. The bottom row is a table over all of the signals – each signal contains only click.

    The pie chart allows us to visualize a simple aggregation of clicks per document. The most popular document got 232 clicks, roughly 1% of the total clicks. The 200th most popular document got 12 clicks, and the vast majority of documents only got one click per document. In order to use information about documents clicked on, we need to make this information available in a form that Solr can use. In other words, we need to create a collection of aggregated signals.

    Aggregated Signals Data: the auxiliary collection ‘bb_catalog_signals_aggr’

    Aggregation is the “processing” part of signals processing. Fusion runs queries over the documents in the raw signals collection in order to synthesize new documents for the aggregated signals collection. Synthesis ranges from counts to sophisticated statistical functions. The nature of the signals collected determines the kinds of aggregations performed. For click signals from query logs, the processing is straightforward: an aggregated signal record contains a search query, a count of the number of raw signals that contained that search query; and aggregated information from all raw signals: timestamps, ids of documents clicked on, search query settings, in this case, the product catalog categories over which that search was carried out.

    To aggregate the raw signals in collection “bb_catalog_signals” from the Fusion 2 UI, I choose the “Aggregations” control listed in the “Index” section of the “bb_catalog_signals” home panel:

    aggregations control

    I create a new aggregation called “bb_aggregation” and define the following:

    • Signal Types = “click”
    • Time Range = “[* TO NOW]” (all signals)
    • Output Collection = “bb_catalog_signals_aggr”

    The following screenshot shows the configured aggregation. The circled fields are the fields which I specified explicitly; all other fields were left at their default values.

    aggregations definitions

    Once configured, the aggregation is run via controls on the aggregations panel. This aggregation only takes a few seconds to run. When it has finished, the number of raw signals processed and aggregated signals created are displayed below the Start/Stop controls. This screenshot shows that the 20,000 raw signals have been synthesized into 15,651 aggregated signals.

    run aggregation job

    To check my work, I use the Fusion 2 UI to view the aggregated signals collection, by explicitly specifying the URL “localhost:8764/panels/bb_catalog_signals_aggr”. Aggregated click signals have a “count” field which reflects the number of times the combination search query + document id occur. (Note: my original post stated incorrectly that this ordering shows most popular queries – it doesn’t – this count is over query + action, which is a more complex and more useful piece of information.) The following screenshot shows this sort ordering:

    aggregations result

    The searches over the Best Buy catalog which show strong patterns of user behavior are searches for major electronic consumer goods: TVs and computers, at least according to this particular dataset.

    Fusion REST-API Recommendations Service

    The final part of the example signals script “signals.sh” calls the Fusion REST-API’s Recommendation service endpoints “itemsForQuery”, “queriesForItem”, and “itemsForItems”. The first endpoint, “itemsForQuery” returns the list of items that were clicked on for a query phrase. In the “signals.sh” example, the query string is “laptop”. When I do a search on query string “laptop” over collection “bb_catalog”, using the default search pipeline, the results don’t actually include any laptops:

    default search result

    With properly specified fields, filters, and boosts, the results could probably be improved. With aggregated signals, we see improvements right away. I can get recommendations using the “itemsForQuery” endpoint via a curl command:

    curl -u admin:password123 http://localhost:8764/api/apollo/recommend/bb_catalog/itemsForQuery?q=laptop

    This returns the following list of ids: [ 2969477, 9755322, 3558127, 3590335, 9420361, 2925714, 1853531, 3179912, 2738738, 3047444 ], most of which are popular laptops:

    recommendations result

    When not to use signals

    If the textual content of the documents in your collection provides enough information such that for a given query, the documents returned are the most relevant documents available, then you don’t need Fusion signals. (If it ain’t broke, don’t fix it.) If the only information about your documents is the documents themselves, you can’t use signals. (Don’t use a hammer when you don’t have any nails.)

    Conclusion

    Fusion provides the tools to create, manage, and maintain signals and aggregations. It’s possible to build extremely sophisticated aggregation functions, and to use aggregated signals in many different ways. It’s also possible to use signals in a simple way, as I’ve done in this post, with quick and impressive results.

    In future posts in this series, we will show you:

    • How to write query pipelines to harness this power for better search over your data, your way.
    • How to harness the power of Apache Spark for highly scalable, near-real-time signal processing.

    The post Basics of Storing Signals in Solr with Fusion for Data Engineers appeared first on Lucidworks.


    Securing Solr with Basic Authentication

    $
    0
    0
    Until version 5.2, Solr did not include any specific security features. If you wanted to secure your Solr installation, you needed to use external tools and solutions which were proprietary and maybe not so well known by your organization. A security API was introduced in Solr 5.2 and Solr 5.3 will have full-featured authentication and authorization plugins that use Basic authentication and “permission rules” which are completely driven from ZooKeeper. Caveats
    • Basic authentication sends credentials in plain text. If the communication channels are not secure, attackers can know the password. You should still secure your communications with SSL.
    • ZooKeeper is the weakest link in this security. Ensure that write permissions to ZooKeeper is granted only to appropriate users.
    • It is still not safe to expose your Solr servers to an unprotected network.
     

    Enabling Basic Authentication

    Step 1 : Save the following JSON to a file called security.json:
    {
    "authentication":{
       "class":"solr.BasicAuthPlugin",
       "credentials":{"solr":"IV0EHq1OnNrj6gvRCwvFwTrZ1+z1oBbnQdiVC3otuq0= Ndd7LKvVBAaZIF0QAVi1ekCfAJXr1GGfLtRUXhgrF8c="}
    },
    "authorization":{
       "class":"solr.RuleBasedAuthorizationPlugin",
       "user-role":{"solr":"admin"},
       "permissions":[{"name":"security-edit",
                      "role":"admin"}]
    }}
    The above configuration does the following:
    • Enable authentication and authorization
    • A user called 'solr' is created with a password 'SolrRocks'
    • The user 'solr' is assigned a role 'admin'
    • The permissions to edit security is now restricted to the role 'admin'. All other resources are unprotected and the user should configure more rules to secure them.
    Step 2: Upload to ZooKeeper
    server/scripts/cloud-scripts/zkcli.sh -zkhost localhost:9983 -cmd putfile /security.json security.json
    All solr nodes watch the /security.json and this change is immediately reflected in the nodes behavior. You can verify the operation with the following commands.
    curl http://localhost:8983/solr/admin/authentication
    curl http://localhost:8983/solr/admin/authorization
    These calls should return with the corresponding sections in the json we uploaded.

    BasicAuthPlugin

    The BasicAuthPlugin authenticates users using HTTP’s Basic authentication mechanism. Authentication is done against the user name and salted sha256 hash of the password stored in ZooKeeper.

    Editing credentials

    There is an API to add, edit or remove users. Please note that the commands shown below are tied to this specific Basic authentication implementation and the same set of commands are not valid if the implementation class is not solr.BasicAuthPlugin. Example 1: Adding a user and editing a password
    curl --user solr:SolrRocks http://localhost:8983/solr/admin/authentication -H 'Content-type:application/json'-d '{ 
      "set-user": {"tom" : "TomIsCool" , 
                   "harry":"HarrysSecret"}}'
    

    Example 2: Deleting a user

    curl --user solr:SolrRocks http://localhost:8983/solr/admin/authentication -H 'Content-type:application/json'-d  '{
     "delete-user": ["tom","harry"]}'
    

    RuleBasedAuthorizationPlugin

    This plugin relies on the configuration stored in ZooKeeper to determine if a particular user is allowed to make a request. The configuration has two sections:

    • A mapping of users to roles. A role can be any user defined string.
    • A set of permissions and the rules on who can access what.

    What is a Permission?

    A permission specifies the attributes of a request and also specifies which roles are allowed to make such a request. The attributes are all multivalued. The attributes of request are:
    • collection: The name of the collection for which this rule should be applied to. If this value is not specified, it is applicable to all collections.
    • path: This is the handler name for the request. It can support wild card prefixes  as well.For example, /update/* will apply to all handlers under /update/.
    • method: HTTP methods valid for this permission. Allowed values are GET, POST, PUT, DELETE, and HEAD.
    • params: These are the names and values of request parameters. For example, "params":{"action":["LIST","CLUSTERSTATUS"]} restricts the rule to be matched only when the values of the parameter "action" is one of "LIST" or "CLUSTERSTATUS".

    How is a Permission Matched?

    For an incoming request, the permissions are tested in the order in which they appear in the configuration. The first permission to match is applied. If you have multiple permissions that can match a given request, put the strictest permissions first. For example, if there is a generic permission that says anyone with a 'dev' role can perform write operations to any collection and you wish to restrict write operations to .system collection to admin only, add the permission for the latter before the more generic permission. If there is no permission matching a given request, then it is accessible to all.

    Well Known Permissions

    There are a few convenience permissions which are commonly used. They have fixed default values for certain attributes. If you use one of the following permissions just specify the roles who can  access these. Trying to specify other attributes  for the following will give an error.

    • security-edit : Edit security configuration
    • security-read : Read security configuration
    • schema-edit : Edit schema of any collection
    • schema-read :  Read schema of any collection
    • config-read : Read solrconfig of any collection
    • config-edit : Edit config of any collection
    • collection-admin-read : Read operations performed on /admin/collections such as LIST, CLUSTERSTATUS
    • collection-admin-edit : All operations on /admin/collections which can modify the state of the system.
    • update : Update operation on any collection
    • read : Any read handler such as /select, /get in any collection

    Editing permissions

    There is an API to edit the permissions. Please note that the following commands are valid only for the RulesBasedAuthorizationPlugin. The commands for managing permissions are:
    • set-permission: create a new permission, overwrite an existing permission definition, or assign a pre-defined permission to a role.
    • update-permission: update some attributes of an existing permission definition.
    • delete-permission: remove a permission definition.
    Example 1: add or remove roles
    curl --user solr:SolrRocks http://localhost:8983/solr/admin/authorization -H 'Content-type:application/json' -d '{ 
      "set-user-role": {"tom":["admin","dev"},
      "set-user-role": {"harry":null}
    }'
    
    Example 2: add or remove permissions
    curl --user solr:SolrRocks http://localhost:8983/solr/admin/authorization -H 'Content-type:application/json'-d '{ 
      "set-permission": { "name":"a-custom-permission-name",
                          "collection":"gettingstarted",
                          "path":"/handler-name",
                          "before": "name-of-another-permission",
                          "role": "dev"
       },
     "delete-permission":"permission-name"
    }'

    Please note that the "set-permission" replaces your permission fully. Use the "update-permission" operation to partially update a permission.  Use the 'before' property to re-order your permissions

    Example 4: Restrict collection admin operations (writes only) to be performed by an admin only

    curl --user solr:SolrRocks http://localhost:8983/solr/admin/authorization -H 'Content-type:application/json' -d '{
    "set-permission" : {"name":"collection-admin-edit", "role":"admin"}}'

     This ensures that the write operations can be performed by admin only. Trying to perform a secure operation without credentials with a browser will now prompt for user-name and password:

    Screen Shot 2015-07-22 at 7.51.19 PM

    Example 5: Restrict all writes to all collections to dev role
    curl --user solr:SolrRocks http://localhost:8983/solr/admin/authorization -H 'Content-type:application/json' -d '{
    "set-permission" : {"name":"update", "role":"dev"}}'
    Example 6 : Restrict writes to .system collection to admin only
    curl --user solr:SolrRocks http://localhost:8983/solr/admin/authorization -H 'Content-type:application/json' -d '{
    "set-permission" : {"name":"system-coll-write",
                         "collection": ".system"
                         "path":"/update/*",
                         "before":"update",
                         "role":"admin"}}'
      Please note the 'before' attribute, this ensures that this permission is inserted right before the "update" permission we added in example 5. Example 7 : Update the above permission to  add the /blob* path
    curl --user solr:SolrRocks http://localhost:8983/solr/admin/authorization -H 'Content-type:application/json' -d '{
    "update-permission" : {"name":"system-coll-write", 
                        "path": ["/update/*","/blob/*"]}}'

    Securing Inter-node calls

    BasicAuthPlugin uses Solr’s own mechanism for securing inter-node calls using PKI infrastructure. But the same users, roles and permissions work across the nodes because, the user-name in the original request is carried forward in inter-node requests. (That is topic for another blog)

    The post Securing Solr with Basic Authentication appeared first on Lucidworks.

    Solr Developer Survey 2015

    $
    0
    0
    Every day, we hear from organizations looking to hire Solr talent. Recruiters want to know how to find and hire the right developers and engineers, and how to compensate them accordingly. Lucidworks is conducting our annual global survey of Solr professionals to better understand how engineers and developers at all levels of experience can take advantage of the growth of the Solr ecosystem – and how they are using Solr to build amazing search applications. This survey will take about 2 minutes to complete. Responses are anonymized and confidential. Once our survey and research is completed, we’ll share the results with you and the Solr community. take_the_survey_1x As a thank you for your participation, you’ll be entered in a drawing to win one of our blue SOLR t-shirts plus copies of the popular books Taming Text and Solr in Action. Be sure to include your t-shirt size in the questionnaire. We’d appreciate your input by Wednesday, Sept 9th. Click here to take the survey. Thanks so much for your participation!

    The post Solr Developer Survey 2015 appeared first on Lucidworks.

    If They Can’t Find It, They Can’t Buy It

    $
    0
    0
    Sarath Jarugula, VP Partners & Alliances at Lucidworks has a blog post up on IBM’s blog, If They Can’t Find It, They Can’t Buy It: How to Combine Traditional Knowledge with Modern Technical Advances to Drive a Better Commerce Experience: signals-power-relevance
    “Search is at the heart of every ecommerce experience. Yet most ecommerce vendors fail to deliver the right user experience. Getting support for the most common types of search queries can be a challenge for even the largest online retailers. Let’s take a look at how traditional online commerce and retail is being transformed by technology advances across search, machine learning, and analytics.”
    Read the full post on IBM’s blog. Join us for our upcoming webinar Increase Conversion With Better Search.

    The post If They Can’t Find It, They Can’t Buy It appeared first on Lucidworks.

    Introducing Anda: a New Crawler Framework in Lucidworks Fusion

    $
    0
    0

    Introduction

    Lucidworks Fusion 2.0 ships with roughly 30 out-of-the-box connector plugins to facilitate data ingestion from a variety of common datasources. 10 of these connectors are powered by a new general-purpose crawler framework called Anda, created at Lucidworks to help simplify and streamline crawler development. Connectors to each of the following Fusion datasources are powered by Anda under-the-hood:
    • Web
    • Local file
    • Box
    • Dropbox
    • Google Drive
    • SharePoint
    • JavaScript
    • JIRA
    • Drupal
    • Github
    Inspiration for Anda came from the realization that most crawling tasks have quite a bit in common across crawler implementations. Much of the work entailed in writing a crawler stems from generic requirements unrelated to the exact nature of the datasource being crawled, which indicated the need for some reusable abstractions. The below crawler functionalities are implemented entirely within the Anda framework code, and while their behavior is quite configurable via properties in Fusion datasources, the developer of a new Anda crawler needn’t write any code to leverage these features:
    • Starting, stopping, and aborting crawls
    • Configuration management
    • Crawl-database maintenance and persistence
    • Link-legality checks and link-rewriting
    • Multithreaded-ness and thread-pool management
    • Throttling
    • Recrawl policies
    • Deletion
    • Alias handling
    • De-duplication of similar content
    • Content splitting (e.g. CSV and archives)
    • Emitting content
    Instead, Anda reduces the task of developing a new crawler to providing the Anda framework with access to your data. Developers provide this access by implementing one of two Java interfaces that form the core of the Anda Java API: Fetcher and FS (short for filesystem). These interfaces provide the framework code with the necessary methods to fetch documents from a datasource and discern their links, enabling traversal to additional content in the datasource. Fetcher and FS are designed to be as simple to implement as possible, with most all of the actual traversal logic relegated to framework code.

    Developing a Crawler

    With so many generic crawling tasks, it’s just inefficient to write an entirely new crawler from scratch for each additional datasource. So in Anda, the framework itself is essentially the one crawler, and we plug-in access to the data that we want it to crawl. The Fetcher interface is the more generic of two ways to provide that access.

    Writing a Fetcher

    public interface Fetcher extends Component<Fetcher> {
    
        public Content fetch(String id, long lastModified, String signature) throws Exception;
    }
    Fetcher is a purposefully simple Java interface that defines a method fetch() to fetch one document from a datasource. There’s a WebFetcher implementation of Fetcher in Fusion that knows how to fetch web pages (where the id argument to fetch() will be a web page URL), a GithubFetcher for Github content, etc. The fetch() method returns a Content object containing the content of the “item” referenced by id, as well as any links to additional “items”, whatever they may be. The framework itself is truly agnostic to the exact type of “items”/datasource in play—dealing with any datasource-specific details is the job of the Fetcher. A Fusion datasource definition provides Anda with a set of start-links (via the startLinks property) that seed the first calls to fetch() in order to begin the crawl, and traversal continues from there via links returned in Content objects from fetch(). Crawler developers simply write code to fetch one document and discern its links to additional documents, and the framework takes it from there. Note that Fetcher implementations should be thread-safe, and the fetchThreads datasource property controls the size of the framework’s thread-pool for fetching.

    Incremental Crawling

    The additional lastModified and signature arguments to fetch() enable incremental crawling. Maintenance and persistence of a crawl-database is one of the most important tasks handled completely by the framework, and values for lastModified (a date) and signature (an optional String value indicating any kind of timestamp, e.g. ETag in a web-crawl) are returned as fields of Content objects, saved in the crawl-database, and then read from the crawl-database and passed to fetch() in re-crawls. A Fetcher should use these metadata to optionally not read and return an item’s content when it hasn’t changed since the last crawl, e.g. by setting an If-Modified-Since header along with the lastModified value in the case of making HTTP requests. There are special “discard” Content constructors for the scenario where an unchanged item didn’t need to be fetched.

    Emitting Content

    Content objects returned from fetch() might be discards in incremental crawls, but those containing actual content will be emitted to the Fusion pipeline for processing and to be indexed into Solr. The crawler developer needn’t write any code in order for this to happen. The pipelineID property of all Fusion datasources configures the pipeline through which content will be processed, and the user can configure the various stages of that pipeline using the Fusion UI.

    Configuration

    Fetcher extends another interface called Component, used to define its lifecycle and provide configuration. Configuration properties themselves are defined using an annotation called @Property, e.g.:
    @Property(title="Obey robots.txt?",
            type=Property.Type.BOOLEAN,
            defaultValue="true")
    public static final String OBEY_ROBOTS_PROP = "obeyRobots";
    Web Crawl Datasource UI This example from WebFetcher (the Fetcher implementation for Fusion web crawling) defines a boolean datasource property called obeyRobots, which controls whether WebFetcher should heed directives in robots.txt when crawling websites (disable this setting with care!). Fields with @Property annotations for datasource properties should be defined right in the Fetcher class itself, and the title= attribute of a @Property annotation is used by Fusion to render datasource properties in the UI.

    Error Handling

    Lastly, it’s important to notice that fetch() is allowed to throw any Java exception. Exceptions are persisted, reported, and handled by the framework, including logic to decide how many times fetch() must consecutively fail for a particular item before that item will be deleted in Solr. Most Fetcher implementations will want to catch and react to certain errors (e.g. retrying failed HTTP requests in a web crawl), but any hard failures can simply bubble up through fetch().

    What’s next?

    Anda’s sweet spot is definitely around quick and easy development of crawlers at present, which usually connote something a bit more specific than the term “connector”. That items link to other items is currently a core assumption of the Anda framework. Web pages have links to other web pages and filesystems have directories linking to other files, yielding structures that clearly require crawling. We’re working towards enabling additional ingestion paradigms, such as iterating over result-sets (e.g. from a traditional database) instead of following links to define the traversal. Mechanisms to seed crawls in such a fashion are also under development. For now, it may make sense to develop connectors whose ingestion paradigms are less about crawling (e.g. the Slack and JDBC connectors in Fusion) using the general Fusion connectors framework. Stay tuned for future blog posts covering new methods of content ingestion and traversal in Anda. An Anda SDK with examples and full documentation is also underway, and this blog post will be updated as soon as it’s available. Please Contact Lucidworks in the meantime. Download Fusion

    Additional Reading

    Fusion Anda Documentation Planned upcoming blog posts (links will be posted when available): Web Crawling in Fusion The Anda-powered Fusion web crawler provides a number of options to control how web pages are crawled and indexed, control speed of crawling, etc. Content De-duplication with Anda De-duplication of similar content is a complex but generalizable task that we’ve tackled in the Anda framework, making it available to any crawler developed using Anda. Anda Crawler Development Deep-dive Writing a Fetcher is one of the two ways to provide Anda with access to your data; it’s also possible to implement an interface called FS (short for filesystem). Which one you choose will depend chiefly on whether the target datasource can be modeled in terms of a standard filesystem. If a datasource generally deals in files and directories, then writing an FS may be easier than writing a Fetcher.

    The post Introducing Anda: a New Crawler Framework in Lucidworks Fusion appeared first on Lucidworks.

    Solr as an Apache Spark SQL DataSource

    $
    0
    0
    Join us for our upcoming webinar, Solr & Spark for Real-Time Big Data Analytics. You’ll learn more about how to use Solr as an Apache Spark SQL DataSource and how to combine data from Solr with data from other enterprise systems to perform advanced analysis tasks at scale. Full details and registration…

    Part 1 of 2: Read Solr results as a DataFrame

    This post is the first in a two-part series where I introduce an open source toolkit created by Lucidworks that exposes Solr as a Spark SQL DataSource. The DataSource API provides a clean abstraction layer for Spark developers to read and write structured data from/to an external data source. In this first post, I cover how to read data from Solr into Spark. In the next post, I’ll cover how to write structured data from Spark into Solr. To begin, you’ll need to clone the project from github and build it using Maven:
    git clone https://github.com/LucidWorks/spark-solr.git
     cd spark-solr
     mvn clean package -DskipTests
    After building, run the twitter-to-solr example to populate Solr with some tweets. You’ll need your own Twitter API keys, which can be created by following the steps documented here. Start Solr running in Cloud mode and create a collection named “socialdata” partitioned into two shards:
    bin/solr -c && bin/solr create -c socialdata -shards 2
    The remaining sections in this document assume Solr is running in cloud mode on port 8983 with embedded ZooKeeper listening on localhost:9983. Also, to ensure you can see tweets as they are indexed in near real-time, you should enable auto soft-commits using Solr’s Config API. Specifically, for this exercise, we’ll commit tweets every 2 seconds.
    curl -XPOST http://localhost:8983/solr/socialdata/config \
     -d '{"set-property":{"updateHandler.autoSoftCommit.maxTime":"2000"}}'
    Now, let’s populate Solr with tweets using Spark streaming:
    $SPARK_HOME/bin/spark-submit --master $SPARK_MASTER \
     --conf "spark.executor.extraJavaOptions=-Dtwitter4j.oauth.consumerKey=? -Dtwitter4j.oauth.consumerSecret=? -Dtwitter4j.oauth.accessToken=? -Dtwitter4j.oauth.accessTokenSecret=?" \
     --class com.lucidworks.spark.SparkApp \
     ./target/spark-solr-1.0-SNAPSHOT-shaded.jar \
     twitter-to-solr -zkHost localhost:9983 -collection socialdata
    Replace $SPARK_MASTER with the URL of your Spark master server. If you don’t have access to a Spark cluster, you can run the Spark job in local mode by passing:
    --master local[2]
    However, when running in local mode, there is no executor, so you’ll need to pass the Twitter credentials in the spark.driver.extraJavaOptions parameter instead of spark.executor.extraJavaOptions. Tweets will start flowing into Solr; be sure to let the streaming job run for a few minutes to build up a few thousand tweets in your socialdata collection. You can kill the job using ctrl-C. Next, let’s start up the Spark Scala REPL shell to do some interactive data exploration with our indexed tweets:
    cd $SPARK_HOME
     ADD_JARS=$PROJECT_HOME/target/spark-solr-1.0-SNAPSHOT-shaded.jar bin/spark-shell
    $PROJECT_HOME is the location where you cloned the spark-solr project. Next, let’s load the socialdata collection into Spark by executing the following Scala code in the shell:
    val tweets = sqlContext.load("solr",
     Map("zkHost" -> "localhost:9983", "collection" -> "socialdata")
     ).filter("provider_s='twitter'")
    On line 1, we use the sqlContext object loaded into the shell automatically by Spark to load a DataSource named “solr”. Behind the scenes, Spark locates the solr.DefaultSource class in the project JAR file we added to the shell using the ADD_JARS environment variable. On line 2, we pass configuration parameters needed by the Solr DataSource to connect to Solr using a Scala Map. At a minimum, we need to pass the ZooKeeper connection string (zkHost) and collection name. By default, the DataSource matches all documents in the collection, but you can pass a Solr query to the DataSource using the optional “query” parameter. This allows to you restrict the documents seen by the DataSource using a Solr query. On line 3, we use a filter to only select documents that come from Twitter (provider_s=’twitter’). At this point, we have a Spark SQL DataFrame object that can read tweets from Solr. In Spark, a DataFrame is a distributed collection of data organized into named columns (see: https://databricks.com/blog/2015/02/17/introducing-dataframes-in-spark-for-large-scale-data-science.html). Conceptually, DataFrames are similar to tables in a relational database except they are partitioned across multiple nodes in a Spark cluster. The following diagram depicts how a DataFrame is constructed by querying our two-shard socialdata collection in Solr using the DataSource API: apache-solr-spark-datasource It’s important to understand that Spark does not actually load the socialdata collection into memory at this point. We’re only setting up to perform some analysis on that data; the actual data isn’t loaded into Spark until it is needed to perform some calculation later in the job. This allows Spark to perform the necessary column and partition pruning operations to optimize data access into Solr. Every DataFrame has a schema. You can use the printSchema() function to get information about the fields available for the tweets DataFrame: tweets.printSchema() Behind the scenes, our DataSource implementation uses Solr’s Schema API to determine the fields and field types for the collection automatically.
    scala> tweets.printSchema()
     root
     |-- _indexed_at_tdt: timestamp (nullable = true)
     |-- _version_: long (nullable = true)
     |-- accessLevel_i: integer (nullable = true)
     |-- author_s: string (nullable = true)
     |-- createdAt_tdt: timestamp (nullable = true)
     |-- currentUserRetweetId_l: long (nullable = true)
     |-- favorited_b: boolean (nullable = true)
     |-- id: string (nullable = true)
     |-- id_l: long (nullable = true)
     ...
    Next, let’s register the tweets DataFrame as a temp table so that we can use it in SQL queries:
    tweets.registerTempTable("tweets")
    For example, we can count the number of retweets by doing:
    sqlContext.sql("SELECT COUNT(type_s) FROM tweets WHERE type_s='echo'").show()
    If you check your Solr log, you’ll see the following query was generated by the Solr DataSource to process the SQL statement (note I added the newlines between parameters to make it easier to read the query):
    q=*:*&
     fq=provider_s:twitter&
     fq=type_s:echo&
     distrib=false&
     fl=type_s,provider_s&
     cursorMark=*&
     start=0&
     sort=id+asc&
     collection=socialdata&
     rows=1000
    There are a couple of interesting aspects of this query. First, notice that the provider_s field filter we used when we declared the DataFrame translated into a Solr filter query parameter (fq=provider_s:twitter). Solr will cache an efficient data structure for this filter that can be reused across queries, which improves performance when reading data from Solr to Spark. In addition, the SQL statement included a WHERE clause that also translated into an additional filter query (fq=type_s:echo). Our DataSource implementation handles the translation of SQL clauses to Solr specific query constructs. On the backend, Spark handles the distribution and optimization of the logical plan to execute a job that accesses data sources. Even though there are many fields available for each tweet in our collection, Spark ensures that only the fields needed to satisfy the query are retrieved from the data source, which in this case is only type_s and provider_s. In general, it’s a good idea to only request the specific fields you need access to when reading data in Spark. The query also uses deep-paging cursors to efficiently read documents deep into the result set. If you’re curious how deep paging cursors work in Solr, please read: https://lucidworks.com/blog/coming-soon-to-solr-efficient-cursor-based-iteration-of-large-result-sets/. Also, matching documents are streamed back from Solr, which improves performance because the client side (Spark task) does not have to wait for a full page of documents (1000) to be constructed on the Solr side before receiving data. In other words, documents are streamed back from Solr as soon as the first hit is identified. The last interesting aspect of this query is the distrib=false parameter. Behind the scenes, the Solr DataSource will read data from all shards in a collection in parallel from different Spark tasks. In other words, if you have a collection with ten shards, then the Solr DataSource implementation will use 10 Spark tasks to read from each shard in parallel. The distrib=false parameter ensures that each shard will only execute the query locally instead of distributing it to other shards. However, reading from all shards in parallel does not work for Top N type use cases where you need to read documents from Solr in ranked order across all shards. You can disable the parallelization feature by setting the parallel_shards parameter to false. When set to false, the Solr DataSource will execute a standard distributed query. Consequently, you should use caution when disabling this feature, especially when reading very large result sets from Solr.

    Not only SQL

    Beyond SQL, the Spark API exposes a number of functional operations you can perform on a DataFrame. For example, if we wanted to determine the top authors based on the number of posts, we could use the following SQL:
    sqlContext.sql("select author_s, COUNT(author_s) num_posts from tweets where type_s='post' group by author_s order by num_posts desc limit 10").show()
    Or, you can use the DataFrame API to achieve the same:
    tweets.filter("type_s='post'").groupBy("author_s").count().
     orderBy(desc("count")).limit(10).show()
    Another subtle aspect of working with DataFrames is that you as a developer need to decide when to cache the DataFrame based on how expensive it was to create it. For instance, if you load 10’s of millions of rows from Solr and then perform some costly transformation that trims your DataFrame down to 10,000 rows, then it would be wise to cache the smaller DataFrame so that you won’t have to re-read millions of rows from Solr again. On the other hand, caching the original millions of rows pulled from Solr is probably not very useful, as that will consume too much memory. The general advice I follow is to cache DataFrames when you need to reuse them for additional computation and they require some computation to generate.

    Wrap-up

    Of course, you don’t need the power of Spark to perform a simple count operation as I did in my example. However, the key takeaway is that the Spark SQL DataSource API makes it very easy to expose the results of any Solr query as a DataFrame. Among other things, this allows you to combine data from Solr with data from other enterprise systems, such as Hive or Postgres, to perform advanced data analysis tasks at scale. Another advantage of the DataSource API is that it allows developers to interact with a data source using any language supported by Spark. For instance, there is no native R interface to Solr, but using Spark SQL, a data scientist can pull data from Solr into an R job seamlessly. In the next post, I’ll cover how to write a DataFrame to Solr using the DataSource API. Join Tim for our upcoming webinar, Solr & Spark for Real-Time Big Data Analytics. You’ll learn more about how to use Solr as a Spark SQL DataSource and how to combine data from Solr with data from other enterprise systems to perform advanced analysis tasks at scale. Full details and registration…

    The post Solr as an Apache Spark SQL DataSource appeared first on Lucidworks.

    Viewing all 731 articles
    Browse latest View live