Quantcast
Channel: Lucidworks
Viewing all 731 articles
Browse latest View live

A Look Back at Fusion 4

$
0
0

At the end of February, Lucidworks announced the release of Fusion 4. Since then we’ve been highlighting some of the capabilities and new features that it enabled. Here’s a look back at what we’ve covered:

The Basics

Fusion 4 Ready for Download – Written overview of Fusion 4.0 features.
Fusion 4 Overview – Webinar on the new features in Fusion 4.0.
Machine Learning in Fusion 4 – Short blog outlining Fusion 4 ML features.

A/B Testing

A/B Testing Your Search Engine with Fusion 4.0 – Blog on how to successfully test whether your changes improve or degrade click-throughs, purchases, or other measures.
Experiments in Fusion 4.0 – Webinar on A/B testing.

Head-n-Tail Analysis

Head-n-Tail Analysis in Fusion 4 – Webinar on Head-n-Tail analysis. Head-n-Tail fixes user queries that return results your users aren’t expecting.
Use Head-n-Tail Analysis to Increase Engagement – Blog explaining Head-n-Tail analysis.
Keep Users Coming Back – Technical paper on Head-n-Tail analysis.

Advanced Topics

Advanced Spell Check – Written overview of how Fusion 4 can provide solutions for common misspellings and corrections.
Using Learning to Rank to Provide Better Search Results – Blog overviewing how LTR can be used with Fusion 4 signals.
Increase Relevancy and Engagement with Learning to Rank – Technical paper covering how to implement Fusion 4 signals into Solr’s Learning to Rank algorithm.
Using Google Vision Image Search in Fusion – Short video highlighting how to use Google Vision to implement advanced AI-powered image search in Fusion 4.
Smarter Image Search in Fusion with Google’s Vision API – Blog on how to augment Fusion with Google Vision API.

Fusion 4 is a great release and I’d encourage you to download and try it today.

Next Steps

If you’ve tried Fusion 4 and some of its features, let’s dive deeper and look at some use cases!

The post A Look Back at Fusion 4 appeared first on Lucidworks.


Solr and Optimizing Your Index: Take II

$
0
0

Optimize and expungeDeletes may no longer be so bad for you. They’re still expensive and should not be used casually. That said, these operations are no longer as susceptible to the issues listed in this blog. If you’re not familiar with Solr/Lucene’s segment merging process that blog provides some background that may be useful.

Executive Summary

  • expungeDeletes and optimize/forceMerge implemented by the default TieredMergePolicy (TMP) behave quite differently starting with Solr 7.5.
  • TieredMergePolicy will soon have additional options for controlling the percentage of deleted documents in an index. See: LUCENE-8263 for the current status.
  • TMP now respects the configuration parameter maxMergedSegmentMB for forceMerge and expungeDeletes by default.
  • If you require the old behavior for forceMerge (optimize), you can get it by specifying maxSegments on the optimize command.
  • expungeDeletes has no option to exceed maxMergedSegmentMB.
  • If you have created very large segments as deleted documents accumulate in huge segments, the segments will be “singleton merged” to purge those deleted documents. NOTE: currently this will only happen when your index approaches around 50% deleted docs although a follow-on JIRA may make that tunable.

Introduction

A while ago I wrote a blog about a “gotcha” when using Solr’s optimize and expungeDeletes commit option. As of Solr 7.5 the worst-case scenario outlined in that document is no longer. If you want to see all of the gory details, see LUCENE-7976 and related JIRAs. WARNING! when Solr/Lucene devs get to discussing something like this, it can make your eyes glaze over…

As of Solr 7.5, optimize (aka forceMerge) and expungeDeletes respect the maxMergedSegmentMB configuration parameter when using TieredMergePolicy, which is both the default and recommended merge policy to use.

For such a simple statement, there are some fairly significant ramifications, thus this blog post.

Quick Review of forceMerge and expungeDeletes Prior to Solr 7.5

First a quick review. The default behavior when optimize is run or expungeDeletes is specified on the commit command was that any segments that get merged were merged into a single segment regardless of how large the resulting segment became.

  • For optimize, then entire index was merged into the number of segments specified by the maxSegments parameter (default 1).
  • For expungeDeletes, all the segments that had more than 10% deleted documents were combined into a single segment.

For “natural” merging as an index is being updated, each hard commit initiated a process as follows:

  • all segments with < 50% of maxMergedSegmentMB “live” docs were examined and selected segments were merged.
  • “selected segments” means that heuristics were applied to try to select the merges causing the least work and still respect maxMergedSegmentMB

The critical difference here is that optimize/forceMerge and expungeDeletes did not respect maxMergedSegmentMB.

Why was maxMergedSegmentMB implemented in the first place?

There’s a long discussion here, but I’m going to skip much of it and say that keeping an index up to date has to deal with a number of competing priorities and maxMergedSegmentMB was part of resolving those issues. The various bits that need to be balanced include:

  • Keeping I/O under control as indexing and searching can be sensitive to I/O bottlenecks.
  • Keeping the segment count under control to prevent running out of file handles and the like.
  • Keeping memory consumption under control, the idea of requiring, say, 5G on the heap just for indexing is unacceptable.
  • When originally written, there were significant speed gains to be had by merging down to one segment, later versions of Solr don’t show the same level of improvement.

As Lucene has evolved, the utility of forceMerge/optimize has lessened, but the underlying merge policy needed to catch up.

The New Way

As of Solr 7.5, optimize (aka forceMerge) and expungeDeletes now use the same algorithm that “natural” merges use. The relevant difference between “natural”, “forceMerge/optimize”, and “expungeDeletes” is what segments are candidates for merging. There are three cases:

  • natural: all segments are considered for merging. This is the normal operation when indexing documents to Solr/Lucene. The various possibilities are scored and the cheapest ones are chosen as measured by estimates of computation and I/O. Large segments with few deletions are unlikely to be considered cheap and thus rarely merged.
  • expungeDeletes: segments with > 10% deleted documents, no matter how large are considered for merging.
  • optimize: Siiiigh, here are 2 sub-cases, maxSegments is defined and maxSegments is not defined:
    • maxSegments is specified: all segments are eligible.
    • maxSegments not specified: all segments < maxMergedSegmentMB “live” documents and all segments with deleted documents are eligible. Thus segments > maxMergedSegmentMB that have no deleted docs are not eligible.

“Wait” you cry! “You’ve told us that maxMergedSegmentMB is respected for expungeDeletes and optimize/forceMerge, yet you can specify maxSegments = 1 and have segments waaaaaay over maxMergedSegmentMB! How does that work?”. I’m so glad you asked (I love providing both sides of the argument. While I can disagree with myself, I never lose the argument! Yes you do. No I don’t. You’re a big stupid-head… Excuse me, my therapist says I should perform calming exercises when that starts happening).

Ok, I’m back now. TMP in Solr 7.5 introduces a “singleton merge”. Whenever a segment qualifies for merging, if it’s “too big” it can be re-written into a new segment, removing deleted documents in the process.

This has some interesting consequences. Say you have optimized down to 1 segment and start indexing more docs that cause deletions to occur. The blog post linked at the top of this article expounds on the negatives there, namely that that single large segment won’t be merged away until the vast majority of it consists of deleted documents. This is no longer true. When certain other conditions are met, a “singleton merge” will be performed on that one overly-large segment, essentially rewriting it to exactly 1 new segment and removing deleted documents. It will gradually shrink back to under maxMergedSegmentMB, at which point it’s treated just like any other segment.

WARNING: This comes at a cost of course, that cost being increased I/O. Let’s say you have a segment 200GB in size. Let’s further say that it consists of 20% deleted documents and is selected for a singleton merge. You’ll re-write 160GB at some point determined by the merging algorithm. It gives you a way to recover from conditions outlined in the blog linked at the beginning of the article that doesn’t require re-indexing, but it’s best by far to not get into that situation in the first place.

I’ll repeat this several times. Do not assume optimize/forceMerge and/or expungeDeletes are A Good Thing, measure first. If you can show evidence that it’s valuable in your situation, then only do these operations under controlled conditions as they’re expensive.

Still You’re Talking About 50% Deleted Documents, That’s Still Too Much.

I’m so glad you asked reprise.

A follow-on JIRA LUCENE-8263 provides a discussion of the approach used to control this. I’ll update this blog post when the code is committed to Solr. You’ll be able to specify that your index consists of no more than a defined percentage of deleted documents.

WARNING: TANSTAAFL (There Ain’t No Such Thing As A Free Lunch). This reduction in deleted documents will come at a cost of increased I/O as well as CPU utilization. If the percentage deleted docs matters, it’s preferred to just expungeDeletes during off hours.

Why expungeDeletes rather than forceMerge/optimize? Well, it’s a judgement call, the consideration being whether you’re willing to expend the resources to rewrite a segment that’s 4.999G in size to reclaim 1 document’s worth of resources.

What do you recommend?

In order of preference:

  1. Don’t worry, be happy! Unless you have good reason to require that deleted docs are purged, just don’t worry about it. Let the default settings control it all.
  2. When LUCENE-8263 is available (probably Solr 7.5), assign a new target percent deleted to TMP (solrconfig.xml for Solr users), and measure, measure, measure. This will increase your I/O and CPU utilization when doing your regular indexing. Especially if you only test in a development environment that increased load may not seem significant but may become significant in production.
  3. Periodically execute a commit with expungeDeletes. Don’t fiddle with the 10% default, it represents a reasonable compromise between wasted space and out-of-control I/O. Lucene is very good at skipping deleted docs, the main expense is disk space and memory. If those aren’t in short supply, leave it alone (or even increase it).
  4. Optimize/forceMerge periodically. This is not nearly as “fraught” as before as the maxMergedSegmentMB is respected, so you won’t automatically create huge segments. But you will generate more I/O and CPU resources than an expungeDeletes.
  5. Optimize/forceMerge with maxSegments=1. This is OK if (and only if) you can tolerate re-running the command regularly. One typical pattern is when an index is updated only once a day during off hours and you can follow that up with an optimize/forceMerge.

Conclusion

Optimize/forceMerge are better behaved, but still expensive operations. We strongly advise that you do not do these at all without seriously considering the consequences. A horrible anti-pattern is to do these operations from a client program on each commit. In fact we discourage even issuing basic commits from a client program.

If you’ve tested rather than assumed that that optimize/forceMerge and/or expungeDeletes is beneficial, run them periodically from a cron job during off hours.

The post Solr and Optimizing Your Index: Take II appeared first on Lucidworks.

Pharma is the New Google

$
0
0

The traditional method of drug discovery in the pharmaceutical industry is failing. There are fewer drugs coming out on the market. Those drugs are developed at a much greater cost than ever before and those costs are increasing. There are only so many mechanisms of action that are common among everyone and treat a major disorder with an acceptable set of side effects. So the industry has been looking less toward “blockbuster” drugs and more toward treatments for increasingly rare diseases and disorders. Those rare disorder medications command a premium instead and require fewer clinical test subjects to develop. However, payers may not be willing to pay those premiums.

The Personalized Medicine of the Future

There is, however, considerable cause for hope in the industry. New technologies are making a more personalized form of medicine possible. The cost of sequencing a person’s DNA now costs less than an MRI (http://time.com/money/2995166/why-does-mri-cost-so-much/). This has helped give birth to a new field of medicine called pharmacogenomics.

Pharmacogenomics may soon allow the creation of drugs, drug therapies, and biosynthetics that target individuals or classes of people with specific genetic variations. A subset of this, oncogenomics, aims at targeting cancers that specific individuals are genetically more susceptible to, while navigating the toxicity and lethality of synthetic drugs for each person. This new field of personalized, gene-centered medicine may allow for more effective treatments and reinvigorate the pharmacological pipeline from a business standpoint.

However, personalized pharmacogenomics requires that the current state of the pharmaceutical industry change. First of all, it requires new business models. It won’t be enough to simply throw a drug on the market and market it. Instead, the pharmaceutical company will need to be more closely involved in treatment and will need to continuously gather data about treatment and treatment effectiveness.

Medicine is Data

In essence, if a pharma company isn’t already a data company on par with Google or Facebook, they must become so now. All of the R&D, treatment, and marketing will create a ton of data.

Rather than a unidirectional process of research, clinical trials, then treatment in the field, the development process will become continuous and more patient-centric. As patients are treated and data is gathered about efficacy and negative effects, new approaches and new treatments will be adapted — at the genomic level — generating ever more data along the way. Development of these treatments will start in the computer instead of in the laboratory. This type of research and development has actually been happening for a while now, but is about to become pervasive and standard.

Managing and matching that data to its purpose and then evolving that data over time will require a completely new approach, different from the traditional big data warehouse or big data lake. Those may still end up being a part of the process, but they are not sufficient. This new approach means that we’re forever searching for data, in real time, over different sorts of datasets, and in ever evolving forms.

AI in Pharma

When we think about finding the right compound or sequence for an individual genome, it is essentially a matching problem, over a large amount of data. This kind of problem is exactly what AI approaches, like machine learning, were designed to do. What a researcher does in terms of applying a process, learning about the results, and using that experience to try something new, is exactly what deep learning is designed to do.

The new research lab starts inside of a computer and extends to the field. The new most valuable researcher on your team might be an algorithm. These algorithms and AI models may end up transforming the pharmaceutical industry in the same ways that they transformed finance and high frequency trading.

Your Biological Data Are Your Signals

Ecommerce companies like Amazon and search/data companies like Google have used behavioral signals, like what a user clicked on, scrolled through, or bought, to profile user behavior and influence purchases.

Medicine has the same kind of problem. There are biological signals (responses to medication, effects, side effects) and behavioral signals (did the user take the medicine, sleep, run, walk) to track, record, and compare. The optimum course of treatment may be a combination of biologics, drugs, and lifestyle changes necessary to achieve optimal health, cure of a disease, or at least alleviate the symptoms of disease. The same kinds of algorithms that Google and Amazon use to influence behavior are the same kind of algorithms that a treatment may require.

How Can This Work?

A key challenge is managing this data and developing, applying, and refining the algorithms and models. Unfortunately, existing data systems either require heavily structured static approaches to data or are just big fat filesystems that require each user to learn everything about each data structure before making use of it. Moreover, both systems require laborious external data cataloging and curation systems.

The data system of the future for pharma requires handling unstructured text or numeric data, semi-structured changeable schematic data, as well as structured data. The data needs to be discoverable and self-documentable. The data system needs to be able to scale as ever-increasing amounts of data are gathered and used in real-time.

Data transformations need to be addressible in stages and allow multiple evolving algorithms and models to be applied. Data also needs to be distributable, exportable, shippable, and usable on a global basis. AI algorithms and models have to be managed, maintained, applied, and tested. All of this requires a mature but future-looking platform.

Learn more:

The post Pharma is the New Google appeared first on Lucidworks.

Big Data is Failing Pharma

$
0
0

The pharmaceutical industry generates ever increasing volumes of data, so it isn’t surprising that pharmaceutical companies have spent a lot of money on big data solutions. Yet most of these systems haven’t yielded the kind of value that was initially promised. In short, “Eroom’s Law” – the slowdown in bringing drugs to market despite improvements in technology – has yet to be broken and these big data “solutions” have yet to bare fruit.

Part of the problem is one of extremes. Previous systems for the pharma industry were based on antiquated, heavily-structured paradigms. These data warehousing systems assumed that you captured and composed data with specific questions in mind.

In recent years, the pharma industry has invested heavily in “data lake” style technologies. Essentially, capture the data first and hope to find a use for it later. While the amount of data captured has increased, we’re still waiting for the outcomes.

As Philip Bourne of the Skagg School of Pharmacy put it, “We have this explosion of data which in principle allows us to do a lot. […] we’re starting to get to an understanding of complex systems in ways that we never have before. That should be impacting the drug discovery process. At this point in time, I don’t think it is, but I think we’re on the cusp of a turnover. And of course the information technology that’s needed to do all this […] is obviously improving. So, let optimism rule.”Memory storage versus drug cost graph

Source: Moore’s and Eroom’s Law in a Graph -Skyrocketing Pharma R&D Costs Despite Quantum Leaps in Technology

But the Data Lake Isn’t Quite Right

Data warehouses aren’t enough. Organizing data into clear table structures or cubes for answering one research question is a bit “too far down the line” to work in a HOLNet or modern pharmaceutical research approach. This is still useful at some point in the drug development lifecycle, but it is too rigid for more general use.

At the same time dumping everything into a data lake – a big unstructured store – and digging it out with analytics tools hasn’t really worked that well either. Actually, that hasn’t worked anywhere. It is a little like deciding that building warehouses didn’t keep up with production, so we built a big fat ditch and shoveled the data in there. The warehouse was at least well organized. Does anyone feel that way about their data lake?

pie chart

Source: 451 Research

A big problem with the data lake approach is that it throws the baby out with the bathwater. A data lake is like having the internet, with everything you’d ever want to know at your fingertips, but with no Google. Some companies have tried methodical approaches similar to using a card catalog and librarian to manage the data (i.e. data management and curation solutions). Clearly, with pharma data doubling every five months these approaches aren’t very likely to work now or in the long run.

Off-the-shelf Analytics Tools Are Inadequate

The analytics market is huge, there are hundreds of vendors with thousands of offerings. Meanwhile, it never ceases to amaze me what people can do with simple tools like Microsoft Excel and a VLOOKUP. However, using generic domain-agnostic analytics tool like Tableau to analyze complex, pharmaceutical research and clinical trials data is like draining a lake with a teaspoon.
Generic tools don’t understand the domain, and the metadata is too abstract for a researcher or analyst to navigate a dataset easily. Moreover, if only a few experts in an organization can understand the data, it fails to serve the modern networked approach of developing drugs and biologics.

A Different Approach To Data Storage

What is needed is a storage mechanism that is both flexible and organized. However, the most important thing is also the simplest: data should be indexed at the storage level as was the case in the decades before data lakes. Otherwise, loading the data (even into a memory-based solution) takes an eternity. Indexes are what is needed to find anything efficiently. They are the “Google” of your internal storage.

Data storage must:

  • Allow data to be organized in flexible document structures with a schema that is easily added to.
  • Scale as the volume of data grows (doubling every 5 months)
  • Perform full-text, ranged, and other kinds of searches quickly with sub-second response times.
  • Most of all be flexible. There are future uses for the data we don’t yet know about. Change is a constant. Rigid structures and tools break down under the pressure of modern pharmaceutical research, development, and marketing.

Better Analytics and Information Sharing

Analytics tools shouldn’t be so heavily customized as to incur the money or time cost of a massive IT project, but should be domain-aware and purpose-specific enough to allow sharing across research, development, marketing, and beyond without the need for data specialists to answer every question.

Out-of-the-box tools are great, but insufficient for the task. Just like pharmaceutical plants are built out of a combination of prefabricated, off-the-shelf and custom parts and materials, so must pharmaceutical analytics and information systems. They can’t be completely custom, nor completely generic. They should essentially be “fit for purpose.”

Better Data Management

There is too much data coming in too quickly to be manually curated. Incremental data enrichment and enhancement systems are needed. Data must be identified, tagged, enhanced, culled, and combined in increasing volume, and sometimes in real-time.


Additionally, new techniques using artificial intelligence technologies, like machine learning and deep learning, are required for modern data management. AI finds patterns and allowing the system to cluster and classify data on the fly. AI does not abrogate the need for industry knowledge and expertise, but augments it to allow researchers and marketers alike to deal with ever increasing amounts of data.

…In other words, these tools help turn data into actual information.

With ever increasing amounts of data, including clinical trials data, molecular data, Electronic Health Records (EHR/EMRs) and soon even data from smart pills, the pharmaceutical industry needs solutions that flexibly store, augment, transform, match, share, and analyze data. The systems need to scale with the data and facilitate it throughout the organization. Generic analytical tools and data lakes have failed to facilitate increased productivity and profitability. New and better approaches are needed.

Learn more:

The post Big Data is Failing Pharma appeared first on Lucidworks.

Open Source History Foretells the Future of Pharma and Omics

$
0
0

The traditional model of siloed peer-reviewed journals and restricted research may give way as the pharmaceutical industry is transformed from relying on blockbusters and rare disease drugs for high volume to more personalized treatment for higher margin. For this model to work, the cost of research can’t continue to rise. Instead of keeping every compound proprietary and patented, the need to control costs may push pharma to a more open research and development model.

Right now, researchers all over the world are working diligently to match a molecule to a receptor on a cell or a virus. Some of that research will be academic and done in universities or educational institutions, some of it done in pharmaceutical company funded laboratories.

Meanwhile, NIH funding for this kind of lifesaving research is falling. Development costs of new drugs and biologics are rising and the chance of a new drug making it out of development to market is 1 in 1000. There needs to be a way to share costs and spread risk that doesn’t destroy profits.

Information sharing and computational models are seen as recipes for accelerating research and lowering risk/costs. These computational models for pharmaceutical research are at the heart of the so-called “omics” revolution. Some lessons from tech giants like Google, IBM, and Facebook may lead to a new kind of model for the pharmaceutical industry and the future of “omics.”

Collaborative Science and the Omics Revolution

Omics is a neologism that encompasses hundreds of fields of study using gene and protein sequencing as well as computer simulations to conduct biological research. Many of these fields, including systems pharmacology, comparative pharmacology, and network pharmacology, map genes and drug interactions across several systems, comparing the results. In the end, there is no room for siloing data to do this successfully and cost effectively.

Every pharmaceutical company is sitting on a compound database. Some companies would rather burn down one of their buildings than share that database without a ton of legal agreements. However, there is a major impetus with the risks and the costs of drug and biologic development to collaborate on this.

The move toward more openness is well underway in the pharmaceutical industry and among biological researchers. There are now databases of proteins and drugs among many others in the area of biological research. There are government efforts toward collaborative drug development. Researchers can now use platforms specifically designed for collaborative science or even participate in open research projects. These benefit the researcher by putting their work in front of a wider audience and the industry because costs are spread among more people.

How Open Source Evolved in Software

This change in the pharmaceutical industry is similar to how software development has evolved. There was a time when nearly every line of code was kept secret, copyrighted, and carefully litigated. Innovation in the computer hardware industry was moving at the rate of Moore’s Law. Meanwhile, R&D in the computer software industry was less fast-paced. Then came the Internet.

A new model of software development emerged that promoted sharing and developing software with a collaborative model, then distributing the works and source code – the very DNA of software – for free! But this did not kill the software industry, it accelerated it. Companies from the likes of IBM to Google to Lucidworks began participating in key engine (i.e Solr) and platform development (i.e. Spark) in open source communities, then productizing and augmenting that software with additional features or services required for corporate customers.

Like omics and bioinformatics, early open source efforts and even the world wide web and Internet itself – were oversold. Initial enthusiasm turned to skepticism and a pullback occurred. This happened, as usual, right before the payoff. The companies that weathered the store (i.e. Amazon) were able to grow to new heights.

Open source software, rather than destroying the software industry with free software that anyone could download and use, reinvigorated and accelerated it. There is virtually no business or consumer software product that you can buy today that doesn’t contain open source software or software libraries.

How This Might Play Out

As the industry begins to develop collaborative and open research models, this will create new challenges in commercialization. In some areas, the model will be straightforward:

  • Generics using open databases and emphasizing cost controls and delivery models.
  • Biosimilars using research and similar drugs and biologics to reduce side effects.
  • Delivery systems and therapies moving beyond the simple pill model to compose therapies that ensure patient compliance and better outcomes.
  • Repurposing using existing compounds in new and novel ways to treat other ailments.
  • Combination therapies combining multiple compounds and biologics to produce a combined effect. This is similar to the antiretroviral treatments pioneered for HIV.

Other models will use bodies of research to develop truly innovative cures and even blockbuster drugs. As this revolution in data science and genomic research moves forward along with the social change of how research is shared, we can expect a compounding effect similar to what has happened in the tech industry.

Ending Data Silos

Pharmaceutical companies aren’t going to give up all of their competitive advantages, just like software companies who participate in open source development generally keep something back. However, through sharing and better data systems technologies, there will be ever increasing amounts of sharing of both datasets and platforms.

Learn more:

The post Open Source History Foretells the Future of Pharma and Omics appeared first on Lucidworks.

Data Lets Pharma Fail Early, Fast, and Cheap

$
0
0

Pharma companies are in the business of data. Each step in creating a new treatment involves gathering data in order to improve process, efficacy, safety of a treatment, and how a drug is marketed, priced, or sold.

One of pharma’s primary challenges in drug creation is figuring out which compound might bind to which receptor in which system to produce the desired therapeutic benefits – and what might be the side effects. When a data scientist thinks about this type of problem, they see it as a classification problem, meaning the same kind of classification algorithm that finds products in a retailer’s online catalog or detects potential fraud in financial services can help find the next life-saving medication.

The Massachusetts Institute of Technology (MIT) uses a deep learning technique to identify markers of toxicity in a database of candidate molecules. Given that 90% of small molecules fail due to toxicity or efficacy in the first phases of research or development, anything like this that helps eliminate candidates before then is a significant cost benefit.

Other AI models can also be used to find candidate compounds and fragments to use in future drugs. Merck has a project called Atomwise that uses a similar technique to search billions of compounds for candidates that could be considered in treatments that are both effective and safe.

Consider the rewards of AI techniques like machine learning:

  • Find a one in a billion compound that is effective at treating a disease.
  • Discover a candidate is likely to be toxic in humans before filing an IND or a phase 1 clinical trial
  • Detect anomalies in clinical trials data in real-time.

The rewards are great but so are the challenges. Data in pharmaceutical development from databases to CROs is siloed and in different formats. Often times data is even tagged incorrectly and those errors propagate. Moreover, life sciences companies have invested heavily in technologies like Hadoop that have failed to deliver on their promise of providing accessible data across the pharmaceutical research and development lifecycle. Instead, these solutions deliver slow, inscrutable access for only a few people at a time and usually with a data-engineer required nearby.

The next steps for data in life sciences are:

  • Using proven data technologies that make storing and accessing data fast, efficient, and simple.
  • Using AI technologies not just to find molecules but to find errors in the data itself.
  • Deploy made-for-purpose tools that offer visualized access across the discovery, development, and commercialization processes.

By doing this, users across the discovery, development, and commercialization processes will be able to view data they understand. Data quality will improve over time. Access will be cheaper, faster and more efficient.

In a connected life sciences company, the next life saving drug may be found first by an algorithm before being vetted by a researcher. The next Torcetrapib might be eliminated early in phase 1 or maybe before even the first rat has tasted it. Whether it is a new discovery or cutting losses on a malignant molecule — data could save lives and dollars.

Learn More:

The post Data Lets Pharma Fail Early, Fast, and Cheap appeared first on Lucidworks.

Podcast: How AI Uses User Data To Retrieve Information We Need Faster With Better Results

$
0
0

Lasya Marla, Director of Fusion AI at Lucidworks, featured on Future Tech Podcast “How AI Utilizes User Data To Retrieve The Information We Need Online, Faster With Better Results.” Lasya provides an overview of the data optimization improvements AI-based technology is delivering and how advanced machine learning can greatly enhance ecommerce and retail website users’ experiences. Companies and businesses can run recommendation algorithms on their sites’ search engines to increase user enjoyment, efficiency of experience, and ultimately keep the user on the site longer. Lucidworks can facilitate a company’s needs by allowing the retooling of their site and search engine to be semi-automated so that a search developer won’t need to understand what is ‘under the hood’ in order to keep it online and efficiently running. Listen here.

The post Podcast: How AI Uses User Data To Retrieve Information We Need Faster With Better Results appeared first on Lucidworks.

Gartner Names Lucidworks as a Leader in 2018 Insight Engines Magic Quadrant

$
0
0

We are proud to announce that Lucidworks has moved from the Challengers quadrant in 2017 to the Leaders quadrant in Gartner’s 2018 Magic Quadrant for Insight Engines. Gartner evaluated thirteen vendors for its 2018 Magic Quadrant for Insight Engines research report and placed Lucidworks in the Leaders quadrant based on completeness of vision and ability to execute. Lucidworks believes its strategic approach to product and process has given the firm the ability to execute on projects typically reserved for larger companies in the space:

“Despite decades of hype, the transformative power of Big Data has not been fully realized,” said Will Hayes, CEO of Lucidworks. “85% of data projects fail to move the needle because they are only built to store, manage, and process data – not provide valuable insights from that data that can be executed on. We take a radically different view of what data means to people. Lucidworks takes a human-centric strategy that connects people with insights when they can best use them. We’re built for action, to maximize every moment, whether it is to delight a customer browsing an online product catalog or a service agent responding to a technical problem.”

The world’s biggest brands rely on Lucidworks Fusion to drive their digital business success. Companies including Verizon, AT&T, Reddit, Red Hat, Moody’s, the US Census and many others. We believe that Lucidworks’ position in the Leaders quadrant showcases Lucidworks’ continued ability to correlate the right data with behavior and intent and forge it into human form that provides clarity for driving every digital moment.

“We have implemented Lucidworks’ Fusion platform across multiple business functions,” said Scott Ross, SVP of Omni-Channel Technology at Lowe’s. “Competing in today’s omni-channel world requires a mastery of the volumes of data generated by machines, humans, and systems in real-time and at massive scale. With Fusion, we can focus on exceeding our customers’ expectations, while increasing productivity of our associates, knowing that we have the tools to give us the scale, speed, and data-centric results we need to innovate in an ever-changing retail environment.”

A complimentary copy of Gartner’s 2018 Magic Quadrant for Insight Engines research report is available here https://lucidworks.com/gartner-magic-quadrant-2018/

The post Gartner Names Lucidworks as a Leader in 2018 Insight Engines Magic Quadrant appeared first on Lucidworks.


Visualizing Clinical Trials

$
0
0

Whether you’re in pharma, biotech, or somewhere in between, there is a powerful moment of truth when your drug has gotten its IND approved, gone through animal trials, and is ready for human trials. There are a lot of new challenges involved. Clinical trials are where all of the big risks live, often costing over $2b per new drug or biologic.

Back in the old days, clinical trials were monitored entirely by site visits. All Interim Monitoring Visits (IMVs) were conducted in person by a Clinical Research Associate. As costs have risen and technology has progressed, sponsors have insisted on using a combination of Remote Monitoring Visits, Risk-Based, and Real-Time Monitoring.

Research funded by the National Institutes of Health (NIH) shows that with better visualization, understanding clinical trials data required on average 28.1% less time while maintaining similar accuracy. Moreover, the research shows that this doesn’t change based on the participants familiarity of statistics or clinical trials procedure. According to the study, “the combination of having a visualization to reference while reading the status quo published report can further help to save time and increase accuracy.”

At Lucidworks we think you should both be able to visualize and explore clinical trials data. In our example we ingested data from ClinicalTrials.gov and applied our search and AppStudio visualization technologies to it. You can learn more in our Understanding Clinical Trials Data webinar. You can also try the demo yourself.

Clinical Trial Listing

At Lucidworks, we think this holds true well beyond clinical trials data (and other research backs that). Whether in the Biotech industry, small molecule, or other life sciences, adding better search and visualization can make any data easier to explore and comprehend. This speaks to use cases throughout the research, development, commercialization and marketing lifecycles.

Learn more:

The post Visualizing Clinical Trials appeared first on Lucidworks.

How to Solve Data Problems in Pharma

$
0
0
  • The data lake has failed pharma.
  • The data warehouse is inadequate.
  • Research costs are too high.
  • Clinical trial costs are too high.
  • Payers are getting more discriminating.

Data’s promise to pharma is that it will make research more efficient. The truth is that most data is irrelevant and that managing ever increasing volumes of data is difficult. As new techniques have emerged to allow simulating and researching new drugs in silico, many of the old techniques for managing data have perpetuated.

  • Copying all of your data into one place and doing everything via batch processing is no longer feasible.
  • Structuring all of the data for answers to specific questions is no longer possible in every case.
  • The old data visualization tools aren’t enough for a global, diverse workforce.

It is time to break the old barriers, to use new techniques to manage data, to make better use of the data you have, and prepare for a future where you have even more! In other words, if you’re interested in solving data problems, check out the Lucidworks Life Sciences Data Solutions: What You Should Know quick guide.

The post How to Solve Data Problems in Pharma appeared first on Lucidworks.

Fusion 4.1 Ready for Download

$
0
0

We are happy to announce the release of Lucidworks Fusion 4.1, our application development platform for creating powerful search and data applications. This release of Fusion is a significant milestone for our flagship product and further strengthens our focus on accelerated time-to-market solutions and developer productivity, along with significant stability improvements.

With Fusion 4.1, we’ve put a focus on analytics capabilities for our customers who are building data applications for finding insights and heuristics in massive volumes of data.

Fusion SQL Analytics

With many new search apps and platforms, users have to learn a whole new set of commands and operators to access and analyze their data. Continuing with the features launched with Fusion 3, we’ve upgraded Fusion’s SQL compatibility, so you can query your index with familiar SQL commands you already know with subsecond (~250ms) analytics queries that can join against as many as 8 collections containing as many as 2b documents. This includes endpoints that can be accessed with popular BI tools and clients like Tableau, Microsoft’s Power BI, and Apache Zeppelin. We’ve also added enterprise-grade security with support for Kerberos, support for streaming expressions, and improved caching strategies for faster performance and scalability.

App Studio Integration

Fusion App Studio, our UI toolkit, is now fully integrated with, and accessible from, the Fusion admin interface. This enables teams to have a full stack integration from data acquisition and indexing to a deployed end user application.

Fusion App Studio interface

Fusion App Studio interface integration

Expanded Data Acquisition Capabilities

Fusion 4.1 continues to broaden the collection of data sources that applications can index and analyze, including Microsoft’s popular OneDrive service so you can now include Office 365 resources in your search results. Data acquisition is also strengthened with our new bulk Apache Spark-SQL loader for querying and analyzing massive data stores such as Hive, Cassandra, and HBase.

Enhanced Admin UI

We’ve taken feedback from our hundreds of Fusion customers with production deployments and further simplified the back end interface for faster administration. This includes features like autocomplete in key fields, resizable panels across the platform, and expandable code editors for easier editing and configuration.

Fusion welcome screen

And Much More

Other additions include improvements to the Confluence, Web, and Slack connectors, UI advancements to the Object Explorer, and better import/export functionality with our Connectors SDK. Fusion 4.1 is built with Apache Solr 7.4.0 and Spark 2.3.1 in the core.

Webinar: What’s New in Fusion 4

Webinar: What’s New In Fusion 4.1
August, 15 2018 at 10am PDT

Join Lucidworks Senior Director of Product Avi Raju and Technical Engagement Manager Andy Oliver for a guided tour of what’s new and improved with our latest release of Fusion 4.1, including:

  • App Studio integration so you can go from data ingest to a working search application in minutes.
  • Fusion Apps, a grouping of objects that can be exported and shared amongst Fusion instances, reducing time to deployment for new applications.
  • New data acquisition capabilities to load and analyze massive amounts of data from data stores like Cassandra, Hive, and HBase.
  • An improved Connectors SDK that allows data to be ingested from any data source. Improved SQL capabilities to query your index with commands and tools you already know with subsecond (~250ms) response time across billions of documents including endpoints to connect with popular BI tools like Tableau, Microsoft Power BI, and Apache Zeppelin.

Full details and registration.

Get Started Right Now

Download Fusion 4.1 now

Read the release notes for the updates to Fusion Server and Fusion AI.

Go to the documentation.

The post Fusion 4.1 Ready for Download appeared first on Lucidworks.

Accelerate Pharmaceutical Research and Development with AI

$
0
0

Over the past month we’ve covered how pharmaceutical and biotech companies use data and AI technologies to lower costs, accelerate research and development, and commercialize life-saving medications. As medicine becomes more personal and targeted, the amount of data these organizations have to wrangle will continue to expand. Managing—and finding— that data in a distributed global environment will become just as important as new molecules or simulations.

If you’re looking to make better use of data for biophamaceutical research or drug commercialization here are some resources to help:

Next Steps:

The post Accelerate Pharmaceutical Research and Development with AI appeared first on Lucidworks.

Adding Analytics for Better Search

$
0
0

You did it! Your search project was a success, your stakeholders are happy, your enterprise users are happy, your ecommerce sales are higher, and/or your R&D is more productive. Now come the questions from marketing and your internal analysts and other interested parties:

  • Why are we seeing these improvements?
  • What devices are users searching on?
  • How can we do better, provide more relevant results, or close more deals?
  • Did the change we made last week work?

Now you have a dilemma: you need to answer these questions, but turning all of the people who want to know loose on your search infrastructure could impact performance for the very people they want to know about.

Luckily, you’re smarter than that. By moving your analytics off of the search infrastructure you can segment your internal analyst users from your search users or customers.

Production cluster with a separate analytics server


This setup gives you more flexibility. Although modern search infrastructure can handle complex analytics at relatively high levels of scale, your analytics users could produce enough traffic to outgrow the intended capacity of your search cluster. Moreover, the quality of service required for internal analytics users is usually lower than that of search users.

What kinds of things can you do with search-driven analytics? For starters, you can answer any of those why, what, how, and did questions and more. Using tools like Fusion’s analytics capabilities, you can run experiments, see what signals (i.e. clickstreams) are being generated, what your most popular queries are, and why certain queries don’t result in user interaction.

Lucidworks Fusion 4.1 Analytics


Beyond built-in functionality, third-party and industry tools like SAS, Tableau, or even Excel can be connected, allowing your analysts to use tools and techniques that they are familiar with. You might not be so comfortable exposing your production cluster in this way, but with a separate analytics infrastructure you have fewer security and performance considerations.

Tableau connected to Lucidworks Fusion


In the coming weeks, we’ll delve more into how to use analytics in Fusion 4.1 for better visibility into what and how users make decisions.

Next Steps:

The post Adding Analytics for Better Search appeared first on Lucidworks.

What is Digital Manufacturing and Why Should You Care?

$
0
0

“Things fall apart; the centre cannot hold.” The fourth coming of industry is upon us. This new era of digital manufacturing is usually defined as “an integrated approach to manufacturing that is centered around a computer system.” However, like most definitions, it isn’t altogether accurate. Let’s examine the elements of digital manufacturing.

Digital manufacturing is about people working together to create products. Unlike traditional methods, iterative change and improvement is understood and integrated into the process. Unlike traditional manufacturing, the adages “one size does not fit all” and that “any color as long as it is black” is not acceptable. Customers and market demand customization and flexibility.

Digital manufacturing starts with the virtual drafting table, aka CAD/3d modeling software. Designs are built and when they are complex, they are usually built by multiple people, usually out of modular components and often out of electronic parts.

3D industrial product design with CAD/CAM software

For important or expensive components, digital simulations “test” each part or a product. For instance, for a new jet turbine, is it strong enough to hold up to physical stress? What about a plastic component of a company’s hot new device, can it hold up to heat and pressure and absorb a reasonable amount of shock? Knowing this before field testing on actual prototypes is a major cost savings and can even be life saving.

Laser cutters, additive manufacturing, or CNC-based milling equipment create the digitally designed components. Laser cutters and milling equipment is still usually the most affordable or practical way to work with metal and other materials. Additive manufacturing, also called 3D-printing, is often used for plastic components. These computer-controlled systems use designs to do their tasks and out comes a digitally designed component.

Close up shot of 3D printer printing 3D objects

From this process comes prototypes, molds, or real usable production parts. In the case of components, they are assembled into complex devices using robots or people. In the case of prototypes, they can be iterated on or even physically modified and re-digitized using 3d scanners.

Similar to modern software development, in digital manufacturing, change is understood to be an inevitable part of the product design process. There will always be an improvement, a new feature, a stylistic adjustment. This means that designs, processes, and even the programming of assembly robots will be changed — often times quickly and frequently.

Throughout these so-called “smart factories,” people and machines are working together and generating data. There are designs, parts, procedures, and history created at every moment. Analytics and algorithms tell everyone and everything what happened, what went wrong, and even predict the future. This data and analysis includes everything from fault data to supply chain and inventory control.

Engineers working on development of automated production line with robotic parts and applied software in order to increase productivity

Making anything is still a very human endeavor. Both humans and machines need to find the data they need efficiently and in an organized manner. Through search, AI, and advanced data storage technology, relevant data is organized and provided with algorithms based on how it was used and domain area. This information includes everything from supply information, procedural information, as well as fault and sensor data.

Digital manufacturing is changing everything. New devices and components no longer come out yearly. Manufacturers have new capabilities to produce and improve components on the fly. Smart factories are now largely automated and the “know how” to program robotics and use design and simulation software has replaced the hands-on process of the traditional factory worker. However, manufacturing is still a combination of people, process, and products, and improving communication about and between these entities is essential to achieve less scrap, fewer faults, and higher profits.

Next Steps:

*Header image by Christoph Roser at AllAboutLean.com.

The post What is Digital Manufacturing and Why Should You Care? appeared first on Lucidworks.

Using Tableau, SQL, and Search for Fast Data Visualizations

$
0
0

This post builds on my previous blog post, where I introduced the Fusion SQL service: https://lucidworks.com/2017/02/01/sql-in-fusion-3/. Since that post, we’ve been busy adding new optimizations and ensuring better integration with BI tools like Tableau, especially for larger datasets.

In the interest of time, I’ll assume you’re familiar with the concepts I covered in the previous blog post. In this post, I highlight several of the interesting features we’ve added in Fusion 4.1.

Querying Larger Datasets

The Solr community continues to push the limits in size and complexity of data sets that can be handled by Solr. In this year’s upcoming Activate Conference, a number of talks cover scaling Solr into the hundreds of millions to billions of documents. What’s more is that Solr can compute facets and basic aggregations (min, max, sum, count, avg, and percentiles) over these large data sets. The Fusion SQL service leverages Solr’s impressive scalability to offer SQL-based analytics over datasets containing tens to hundreds of millions of rows, often in near real-time without prior aggregation. To reach this scale with traditional BI platforms, you’re typically forced to pre-compute aggregations that can only satisfy a small set of predetermined queries.

Self-service analytics continues to rank high on the priority list of many CIOs, especially as organizations strive to be more “data-driven.” However, I can’t imagine CIOs letting business users point a tool like Tableau at even a modest scale dataset in Solr terms. However, Fusion SQL makes true self-service analytics a reality without having to resort to traditional data warehouse techniques.

To illustrate, let’s use the movielens 20M ratings dataset from https://grouplens.org/datasets/movielens/20m/. I chose this since it aligns with the dataset I used in the first blog post about Fusion SQL. To be clear, 20M is pretty small for Solr but as we’ll see shortly, already stresses traditional SQL databases like MySQL. To index this dataset, use Fusion’s Parallel Bulk Loader (https://doc.lucidworks.com/fusion-server/4.1/reference-guides/jobs/parallel-bulk-loader.html) using the Fusion Spark bootcamp lab: https://github.com/lucidworks/fusion-spark-bootcamp/tree/master/labs/ml-20m
(Note: you only need to run the lab to index the 20M ratings if you want to try out the queries in this blog yourself.)

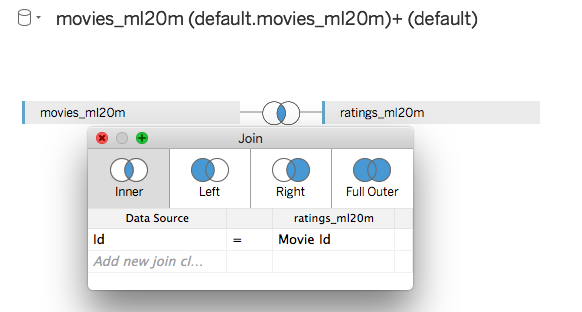
You can set up a join between the movies_ml20m table using (id) and ratings_ml20m table (movie_id) in Tableau as shown in the screenshot below.Tableau screenshot

When the user loads 1000 rows, here’s what Tableau sends to the Fusion SQL service:

SELECT 1 AS `number_of_records`,
`movies_ml20m`.`genre` AS `genre`,
`ratings_ml20m`.`id` AS `id__ratings_ml20m_`,
`movies_ml20m`.`id` AS `id`,
`ratings_ml20m`.`movie_id` AS `movie_id`,
`ratings_ml20m`.`rating` AS `rating`,
`ratings_ml20m`.`timestamp_tdt` AS `timestamp_tdt`,
`movies_ml20m`.`title` AS `title`,
`ratings_ml20m`.`user_id` AS `user_id`
FROM `default`.`movies_ml20m` `movies_ml20m`
JOIN `default`.`ratings_ml20m` `ratings_ml20m` ON (`movies_ml20m`.`id` = `ratings_ml20m`.`movie_id`)
LIMIT 1000

Behind the scenes, Fusion SQL translates that into an optimized query into Solr. Of course, doing joins natively in Solr is no small feat given that Solr is at first a search engine that depends on de-normalized data to perform at its best. Behinds the scenes, Fusion SQL performs what’s known in the database world as a hash join between the ratings_ml20m and movies_ml20m collections using Solr’s streaming expression interface. On my laptop, this query takes about 2 seconds to return to Tableau with the bulk of that time being the read of 1000 rows from Solr to Tableau.

The same query against MySQL on my laptop takes ~4 seconds, so not a big difference, so far, so good. A quick table view of data is nice, but what we really want are aggregated metrics. This is where the Fusion SQL service really shines.

In my previous blog, I showed an example of an aggregate then join query:

SELECT m.title as title, agg.aggCount as aggCount FROM movies m INNER JOIN (SELECT movie_id, COUNT(*) as aggCount FROM ratings WHERE rating >= 4 GROUP BY movie_id ORDER BY aggCount desc LIMIT 10) as agg ON agg.movie_id = m.id ORDER BY aggCount DESC

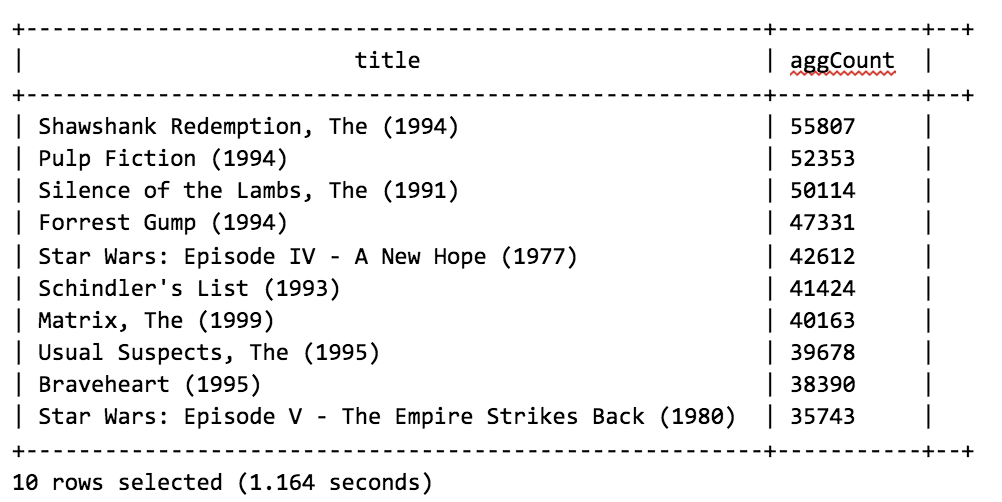
Sadly, when I execute this against MySQL with an index built on the movie_id field in the ratings table, the query basically hangs (I gave up after waiting after a minute). For 20M rows, Fusion SQL does it in 1.2 seconds! I also tried MySQL on an Ec2 instance (r3.xlarge) and the query ran in 17 secs, which is still untenable for self-service analytics.

0: jdbc:hive2://localhost:8768/default> SELECT m.title as title, agg.aggCount as aggCount FROM movies_ml20m m INNER JOIN (SELECT movie_id, COUNT(*) as aggCount FROM ratings_ml20m WHERE rating >= 4 GROUP BY movie_id ORDER BY aggCount desc LIMIT 10) as agg ON agg.movie_id = m.id ORDER BY aggCount DESC;

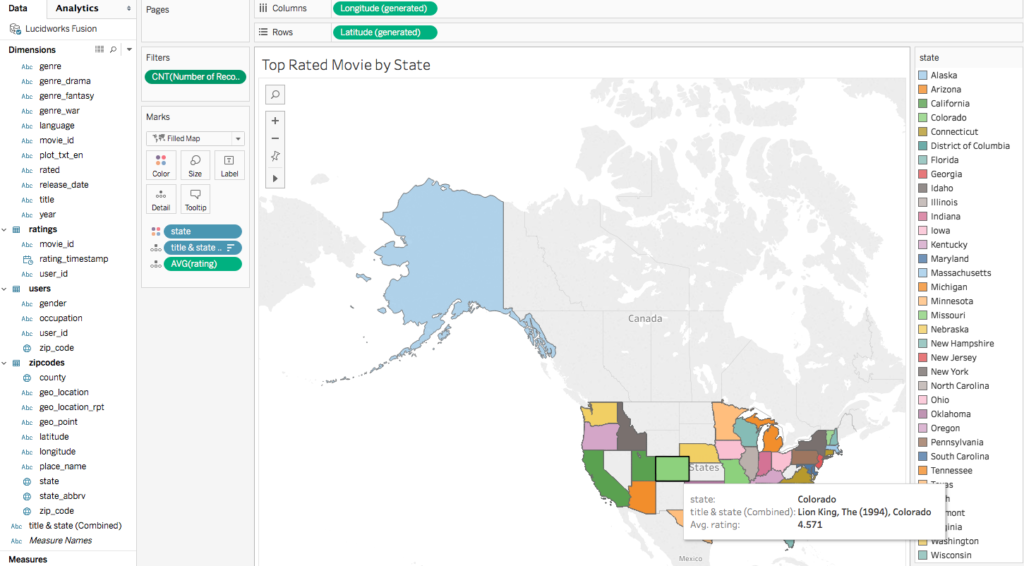
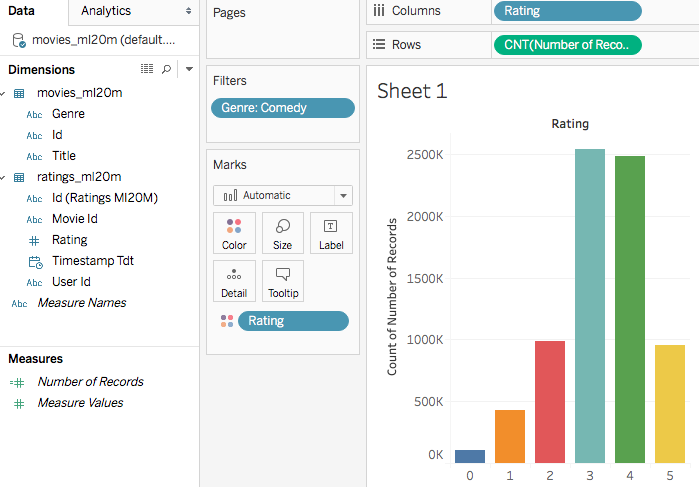
Ok, well maybe MySQL just doesn’t do the aggregate then join correctly there. Let’s try another more realistic query written by Tableau for the following chart:

Tableau screeshot2

SELECT COUNT(1) AS `cnt_number_of_records_ok`,
`ratings_ml20m`.`rating` AS `rating`
FROM `default`.`movies_ml20m` `movies_ml20m`
JOIN `default`.`ratings_ml20m` `ratings_ml20m` ON (`movies_ml20m`.`id` = `ratings_ml20m`.`movie_id`)
WHERE (`movies_ml20m`.`genre` = ‘Comedy’)
GROUP BY `ratings_ml20m`.`rating`

Fusion SQL executes this query in ~2 secs:

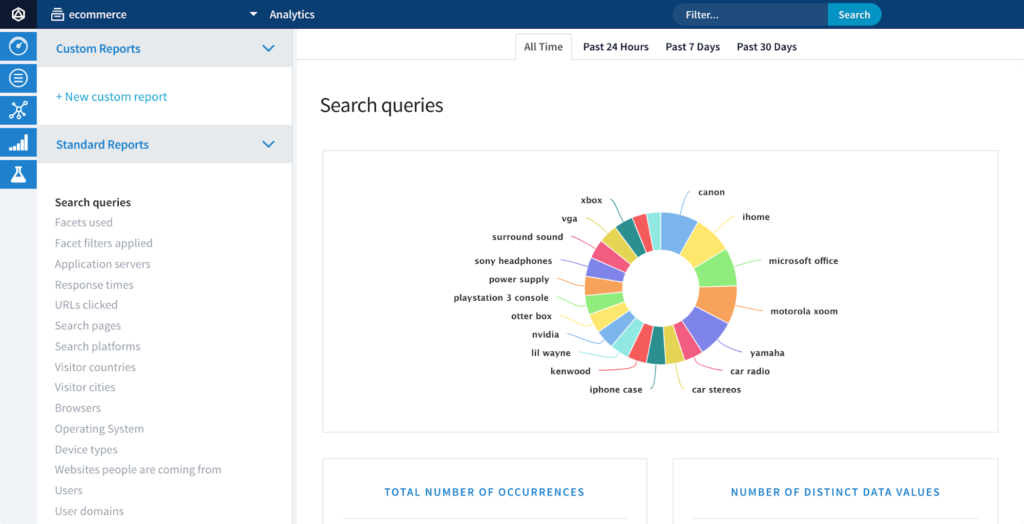
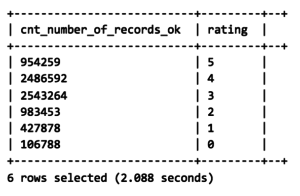
Let’s give that a try with MySQL. First it took >2 minutes to just get the unique values of the rating field, which Fusion SQL does almost instantly using facets:

Fusion screenshot

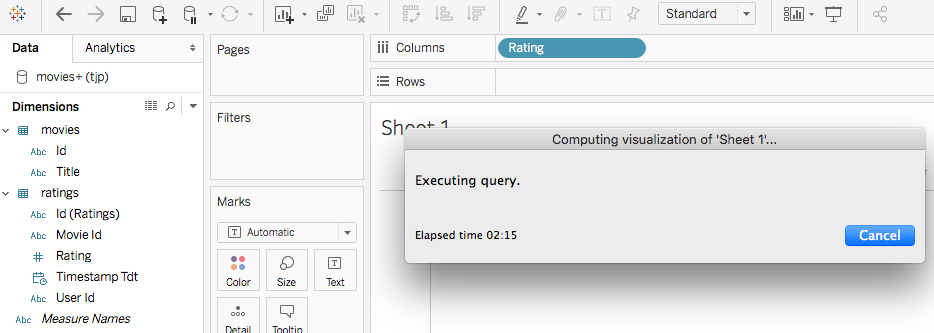
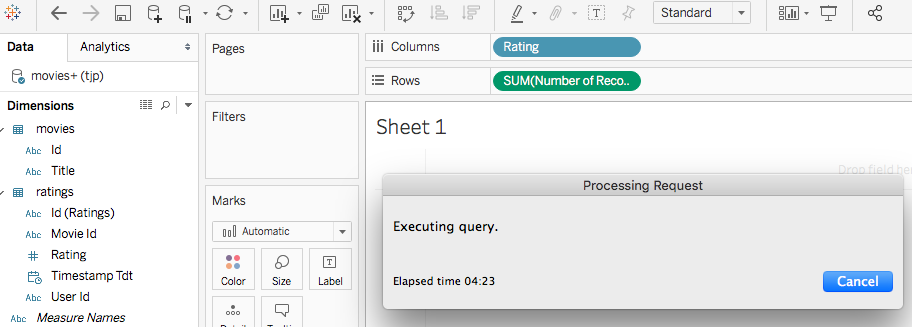
Again, this is against a modest (by Solr’s standards) 20M row table with an index built for the rating column. Then to draw the basic visualization, the query didn’t come back with several minutes (as seen below, we’re still waiting after 4 minutes, it finished around 5 minutes in).

Fusion screenshot

The point here is not to pick on MySQL as I’m sure a good DBA could configure it to handle these basic aggregations sent by Tableau, or another database like Postgres or SQL Server may be faster. But as the data size scales up, you’ll eventually need to setup a data warehouse with some pre-computed aggregations to answer questions of interest about your dataset. The bigger point is that Fusion SQL allows the business analyst to point a data visualization tool like Tableau at large datasets to generate powerful dashboards and reports driven by ad hoc queries without using a data warehouse. In the age of big data, datasets are only getting bigger and more complex.

How Does Fusion Optimize SQL Queries?

A common SQL optimization pattern is to aggregate and then join so that the join works with a smaller set of aggregated rows instead of join then aggregate, which results in many more rows to join. It turns out that Solr’s facet engine is very well suited for aggregate then join style queries.

For aggregate then join, we can use Solr facets to compute metrics for the join key bucket and then perform the join. We also leverage Solr’s rollup streaming expression support to rollup over different dimensions. Of course, this only works for equi-joins where you use the join to attach metadata to the metrics from other tables. Over time, Fusion SQL will add more optimizations around other types of joins.

What About High-cardinality Fields?

If you’re familiar with Solr, than you probably already know that the distributed faceting engine can blaze through counting and basic metrics on buckets that have a low cardinality. But sometimes, a SQL query really needs dimensions that result in a large number of buckets to facet over (high cardinality). For example, imagine a group by over a field with a modest number of unique values ~100,000 but then grouped by a time dimension (week or day), and you can quickly get into a high cardinality situation (100K * 365 days * N years = lots of dimensions).

To deal with this situation, Fusion SQL tries to estimate the cardinality of fields in the group by clause and uses that to decide on the correct query strategy into Solr, either facet for low-cardinality or a map/reduce style streaming expression (rollup) for high cardinality. The key takeaway here is that you as the query writer don’t have to be as concerned about how to do this correctly with Solr streaming expressions. Fusion SQL handles the hard work of translating a SQL query into an optimized Solr query using the characteristics of the underlying data.

This raises the question of what constitutes high-cardinality. Let’s do a quick experiment on the ratings_ml20m table:

select count(1) as cnt, user_id from ratings_ml20m
group by user_id having count(1) > 1000 order by cnt desc limit 10

The query performs a count aggregation for each user in the ratings table ~138K. With faceting, this query executes in 1.8 secs on my laptop. When using the rollup streaming expression, the query takes over 40 seconds! So we’re still better off using faceting at this scale. Next, let’s add some more cardinality using the following aggregation over user_id and rating which has >800K unique values:

select count(1) as cnt, user_id, rating from ratings_ml20m
group by user_id, rating order by cnt desc limit 10

With faceting, this query takes 8 seconds and roughly a minute with rollup. The key takeaway here is the facet approach is much faster than rollup, even for nearly 1 million unique groups. However, depending on your data size and group by complexity you may reach a point where facet breaks down and you need to use rollup. You can configure the threshold where Fusion SQL uses rollup instead of facet using the fusion.sql.bucket_size_limit.threshold setting.

Full Text Queries

One of the nice features about having Solr as the backend for Fusion SQL is that we can perform full-text searches and sort by importance. In older versions of Fusion, we relied on pushing down a full subquery to Solr’s parallel SQL handler to perform a full-text query using the _query_ syntax. However, in Fusion 4.1, you can simply do:

select title from movies where plot_txt_en = ‘dogs’
or
select title from movies where plot_txt_en IN (‘dogs’, ‘cats’)

Fusion SQL consults the Solr schema API to know that plot_txt_en is an indexed text field and performs a full-text query instead of trying to do an exact match against the plot_txt_en field. Fusion SQL also exposes a UDF named _query_ where you can pass any valid Solr query through SQL to Solr, such as:

select place_name,zip_code from zipcodes where _query_(‘{!geofilt sfield=geo_location pt=44.9609,-93.2642 d=50}’)

Avoiding Table Scans

If we can’t pushdown an optimized query into Solr, what happens? Spark automatically pushes down WHERE filters and field projections to the spark-solr library. However, if a query matches 10M docs in Solr, then Spark will stream them from Solr in order to execute the query. As you can imagine, this may be slow depending on how many Solr nodes you have. We’ve seen table scan rates of 1-2M docs per second per Solr node, so reading 10M docs in a 3-node cluster could take 3-5 secs at best (plus a hefty I/O spike between Solr and Spark). Of course, we’ve optimized this as best we can in spark-solr, but the key takeaway here is to avoid queries that need large table scans from Solr.

One of the risks of pointing a self-service analytics tool at very large datasets is that users will craft a query that needs a large table scan, which can hog resources on your cluster. Fusion SQL has a configurable safe guard for this situation. By default if a query requires more than 2M rows, the query will fail. That may be too small of a threshold for larger clusters, so you can increase the threshold using the fusion.sql.max_scan_rows configuration property.

Wrap-up

In this post, I covered how Fusion SQL enables building rich visualizations using tools like Tableau on large datasets. By leveraging Solr’s facet engine and streaming expressions, you can perform SQL aggregations, ad hoc queries, and joins across millions of rows in Solr in near real-time. What’s more is that scaling out Fusion horizontally to handle bigger data sets has never been easier or more cost-effective, especially when compared to traditional BI approaches. If you’re looking to offer self-service analytics as a capability for your organization, then I encourage you to download Fusion 4.1 today and give the SQL service a try.

Next Steps:

The post Using Tableau, SQL, and Search for Fast Data Visualizations appeared first on Lucidworks.


What is the Fourth Industrial Revolution?

$
0
0

Industry 4.0 or the Fourth Industrial Revolution are the new buzzwords that refer to the use of advanced computing, sensors, simulation, and additive techniques in manufacturing. They are largely synonymous with digital manufacturing and smart manufacturing. These techniques are supposed to provide greater customization, as well as faster design modification and personalization.

As opposed to Industry 3.0, which used computing and automation, Industry 4.0 adds intelligence and rapid prototyping along with decentralized decision making. This not only involves new techniques like additive manufacturing but technologies like 3D scanners as well as decision support and data management technologies.

Industry 4.0 evolves to instrumented “smart factories,” which can detect faults during the manufacturing process as well as adjust workspace lighting conditions based on the activity below. These capabilities are based on sensor networks and are commonly referred to as the “Internet of Things” (IoT).

arge modern factory with robots and machines producing industrial plastic pieces and equipment

Industry 4.0, like IoT, has various challenges and sweet spots. For relatively fast-paced developing items, being able to customize, personalize and rapidly prototype changes is essential. However, a lot of what is produced in the world is already relatively modular and doesn’t actually change or get replaced often enough for advanced capabilities.

Manufacturing as a whole has to deal with supply chain complexities. Industry 4.0 may in some cases be limited by which component manufacturer down the chain can adapt to. Moreover, the costs of measuring quality and defects when rapid prototyping and changes are taking place across a multinational supply chain, may outweigh the benefits when compared to more stable “Industry 3.0” practices.

Hand holding tablet pressing button on touch screen interface in front industrial container cargo

Industry 4.0 answers some of these challenges with technologies like “predictive quality”. By using sensor and other data, AI and analytics can detect sources of scrap as well as defects or lower quality output. In today’s manufacturing, these predictive quality tools have to be networked across the supply chain and include data from contract manufacturing organizations (such as Foxconn) in order to be effective.

Industry 4.0, smart factories, and digital manufacturing can be seen as the logical next steps as computing and manufacturing technology have evolved. Industry 4.0 basically extends current techniques by:

Using computer aided design (CAD) technology then simulating stress testing
Deploying sensor networks then adding AI to analyze the data
Using additive and automated manufacturing technologies, making incremental changes in the physical world then re-digitizing them
Using data management and communication technologies to distribute decision making and manage quality across the supply chain

As this fourth industrial revolution takes hold, companies of all industries must take advantage of the capabilities outlined above to satisfy customers and stay ahead of the competition.

Next Steps:


*Header image by Christoph Roser at AllAboutLean.com.

The post What is the Fourth Industrial Revolution? appeared first on Lucidworks.

Putting Partners First with the Lucidworks Partner Program

$
0
0

Today we are happy to announce the launch of our global partner program.

Our slogan is “Partners First” with an emphasis on putting every partner’s success first. The new program includes comprehensive training and certification by Lucidworks, plus extensive practice with our Fusion platform from real-world projects to ensure the highest-quality implementations for customers across all industries.

“Commvault recognized Lucidworks’ innovative AI, machine learning, and cognitive search features very early on, which is why we are excited to be an early adopter and a Platinum Partner,” said Brian Brockway, Vice President and CTO at Commvault. “This technology partnership will help extend on our leading vision and commitment around data protection with integrated powerful tools that give our joint customers valuable AI-driven insights from their data. The Lucidworks Partner Program will enable our field teams and joint channel partners to collaborate more seamlessly in the acceleration of our joint business opportunities.”

By partnering with us, vendors help form a global network of reliable specialists for customers to rely on to bring the power of the Fusion platform to their organizations. The new program provides the structure to equip customers worldwide with the benefits of the our platform, ensuring a complementary fit with our partners.

“Our focus on partners is key to our strategy to bring the power of machine learning and AI to our customers,” said Will Hayes, CEO of Lucidworks. “With this launch, we are committing to customizing success for each partner. This allows our company and our partners to innovate together, blend our unique capabilities, and reach a broader range of organizations looking for operationalized AI.”

Our program also includes OEM partners looking to create their own solutions with embedded Lucidworks technology on a broader SaaS basis or as part of a managed service cloud platform. Additionally, consulting partners who are already a company’s preferred integration vendor, can generate new revenue as system integrators and trusted advisors.

More reactions from Lucidworks partners:

“At Onix, customers have always come first,” said Tim Needles, President and CEO of Onix, a current Lucidworks partner. “We look forward to the new partner program and how it further enhances our collaboration, so we can continue elevating our customers to the next level of enterprise search, relevancy, and productivity.”

“At Wabion we look back on a long history of enterprise search and knowledge management projects,” said Michael Walther, Managing Director of Wabion. “From the beginning of our partnership with Lucidworks we felt a strong commitment to partners like Wabion. In the end the perfect combination of a great product and an experienced integration partner delivers successful projects to our customers and future prospects. We also believe in the commitment of Lucidworks in the European market and their partners.”

“Raytion’s long-standing partnership with Lucidworks aligns with both companies’ commitment to providing the building blocks for the implementation of world-class enterprise search solutions,” said Valentin Richter, CEO of Raytion. “This program ensures that Raytion’s high-quality connectors and professional services complement the Fusion search and discovery platform. Together, with our combined expertise and technology we provide the robust offering our customers worldwide demand and value.”

“Thanx Media is excited to be a Lucidworks partner as they expand their commitment to the Solr community with their Fusion platform,” said Paul Matker, CEO of Thanx Media. “Fusion’s capabilities fit well with our expertise and customer base in the search space so we can continue to offer best-in-class enterprise solutions that help our customers solve their user experience challenges.”

“As a leading solution provider delivering cognitive and AI-based enterprise solutions, Essextec is pleased to be partnering with such a strong technology leader in intelligent search and discovery,” said Evan H. Herbst, SVP Business Development and Cognitive Innovations at Essex Technology Group, Inc. “Lucidworks has been a very supportive partner to Essextec and our clients. We look forward to accelerating our cognitive and AI business as Lucidworks increases their commitment and resources to working with partners through their new program.”

“During our time as a partner with Lucidworks, we have witnessed their growth from a Solr advisory firm to a leader in Gartner’s Magic Quadrant,” said Michael Cizmar, Managing Director of MC+A. “We are excited to have been an early adopter of this program. We are looking forward to mutual growth by working together delivering data transformation and insights to our customers using Lucidworks’ SDKs, machine learning, and App Studio.”

Learn more about the Lucidworks Partner Program at http://lucidworks.com/partners

Full press release about today’s announcement.

The post Putting Partners First with the Lucidworks Partner Program appeared first on Lucidworks.

Our Site Search App Just Got Better

$
0
0

We recently announced the availability of Lucidworks Site Search, an embeddable, easy-to-configure, out-of-the-box site search solution that runs anywhere. The Site Search team just released several new features that make Site Search truly a global citizen:

Language Support

Site Search now supports multiple European languages including French, Italian, German, Polish, Russian, and Spanish for both indexing and searching with auto-detect during web crawls. Language can be configured via the Search API and in embeddable components with language-specific search highlighting. The search UI has also been localized for all the support languages.

Deployment in multiple regions

You can now specify the region where your Site Search application is deployed to ensure low latency and maximum response time for you site’s visitors.

Search API Access

Integrate Site Search with your existing applications and infrastructure for full control of the search experience via our REST API including access to type-ahead and instant results.

Search Analytics

Site Search’s rich analytics give you engagement and usage metrics for queries, results, and users. Current and historical usage reports include searches over time, average response time, rate of queries per day, and other crucial metrics. Use this intel to suggest synonyms, boost, and promote documents for a better user experience.

Spellcheck and Did You Mean

We love typos! Site Search now corrects and suggests misspellings as the user types a query and in the displayed search results.

More Ways to Show Results and Typeahead

In addition to displaying search results as a list, you can now display search results as a set of cards. We’ve also added a number of options for displaying and formatting images with your search results, for a engaging user experience. Typeahead is also now configurable so you can choose between instant results and query suggestions.

Haven’t given it a test drive yet?

Learn more about Site Search and start your trial today: http://lucidworks.com/site-search/

The post Our Site Search App Just Got Better appeared first on Lucidworks.

Create a Search App in under Ten Minutes

$
0
0

Lucidworks Fusion 4.1 allows for rapid search application development. Using Fusion 4.1’s AppStudio feature you can quickly design and deploy search applications. When combined with Fusion’s best in class data ingestion and transformation engine, you can go from “just a bunch of datasources” to a fully searchable index in very little time.

I asked one of our best Solutions Architects, Josh Goldstein, to demonstrate how to create a search application with Fusion 4.1. In under 10 minutes and he recorded a short tutorial. In Josh’s tutorial you’ll learn how to create a Pokemon search application. All you need is this datasource: https://github.com/Biuni/PokemonGO-Pokedex.

So check out the video: Create a Pokemon Search App in under 10 minutes!

Learn more:

The post Create a Search App in under Ten Minutes appeared first on Lucidworks.

SharePoint Search Tuning Guide

$
0
0

Do you experience difficulty with SharePoint Search in getting the results you want, in the order you want?

Do your users complain about seemingly nonsensical reasons that the documents they are looking for appear lower in results than they expect?

Do you wish your team had more control?

We’ve got you covered. Here is a search tuning guide for SharePoint that hopes to resolve – or at least lessen – the plights listed above. We’ll walk through seven different ways to get under the hood and wrangle SharePoint to show search results the way that you want – and the way that your users expect. Including:

  • Boosting on proximity so words and phrases with frequent occurrences can appear higher in search results.
  • Using document freshness and age of a document in relevancy calculations (which SharePoint does not do by default!)
  • Customizing the spelling dictionary with query spelling inclusion and exclusion lists
  • And much more!

This guide shows you exactly what panels to access and what parameters to enter to improve and optimize your SharePoint search so search results have higher relevancy and accuracy and your users find exactly what they’re looking for, the first time:

The post SharePoint Search Tuning Guide appeared first on Lucidworks.

Viewing all 731 articles
Browse latest View live